Wednesday May 12 2021 13:41

3 min
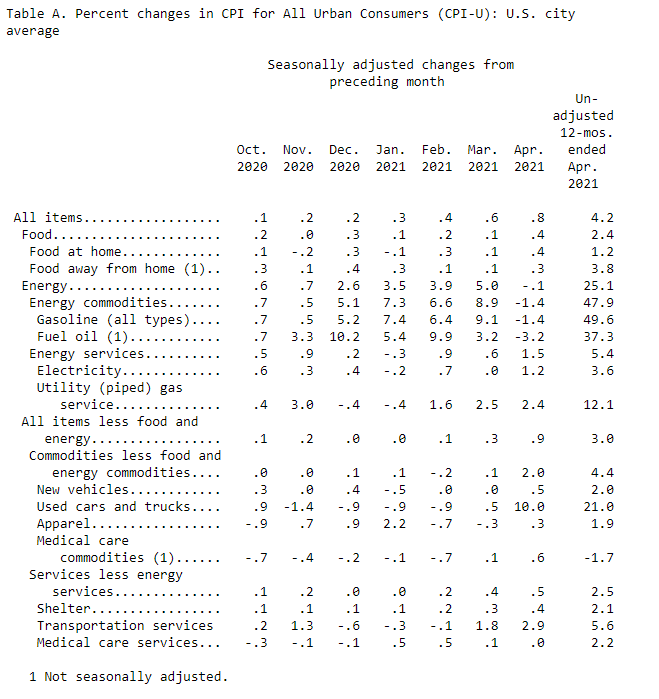
A Volcker-era inflation print: US inflation surged in April, with the year-over-year CPI reading coming in at 4.2%, the highest since Sep 2008 and easily beating the 3.6% expected. Prices rose 0.8% month-on-month, ahead of the 0.2% forecast. A 10% increase in used cars and trucks was the most eye-catching reading with sub-indices (see table below).
The gauge of core inflation made for even more interesting reading, at +0.9% mom and +3% yoy (see chart below). The mom reading was the highest since 1982 when Volcker was in full inflation-busting mode. We can look to lots of things like base effects, supply chain trouble, reopening, pent-up demand, stimulus effects etc as being behind this jump in pricing. Nevertheless, it’s happening; and this perfect storm for inflationary pressures is not about to go away immediately, even if it does, in the end, prove transitory. Yes, it’s predicted – albeit a little hotter than expected – but it’s still bound to stoke worries in the markets about inflation and rising nominal yields. Keep your eyes on the wage growth and job openings for the real inflationary pressure.
As we have noted previously, we can expect a series of hot prints this summer; the Fed has made it clear it will look past these as it thinks inflation will be transitory. We shall only really know if that is the case in a few months’ time. Until then expect gyrations as data shows strong inflation and growth, even if it’s largely predicted.


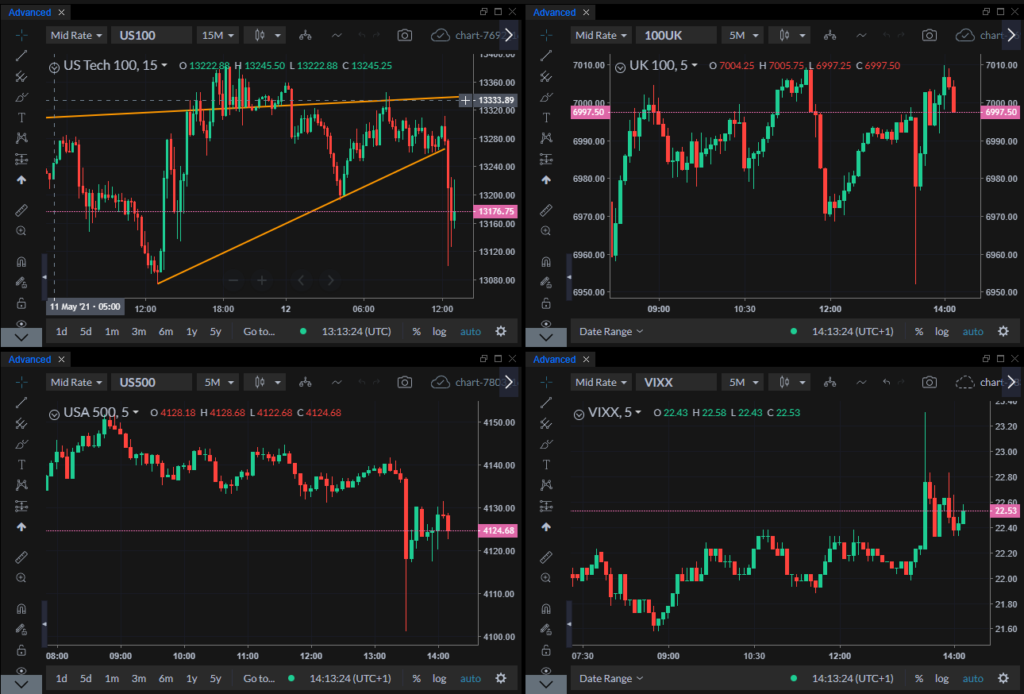
Market reaction: Nasdaq futs predictably fell, benchmark 10-year yields rose to 1.65%. 10-year TIPS breakeven inflation rate rose to 2.591%, the highest since 2013. S&P 500 futs were weaker too but pared some losses ahead of the open. NDX set to open around 13,175, a wee bit above yesterday’s lows under 13,100. Vixx spiked above 23 before settling into the mid-22s.
The FTSE 100 tumbled to day lows at 6,950 on a broad algo-like reaction to the data before rallying to 7,000 again investors woke up and remembered that higher inflation is net good for the UK market since it’s weighted to cyclicals not tech. Strong inflation readings ought to support the UK blue chip index. The dollar caught some bid initially, with DXY spiking to 90.67 on higher yields before giving them all back in short order to sit around 90.30 at pixel time.

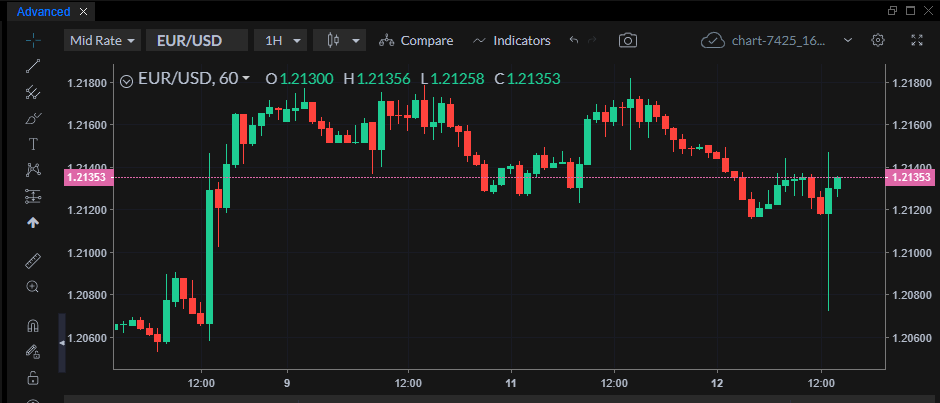
EURUSD moved in a wide range on the release and is now trending to the upside.

