

Markets.com vs eToro: In the South African CFD trading landscape, Markets.com and eToro remain two of the most widely discussed platforms among traders seeking access to global financial markets.
Markets.com vs eToro: The UAE trading community has expanded rapidly in recent years, with retail traders showing growing interest in CFDs linked to forex, stocks, commodities, indices, and cryptocurrencies.
Forex Market Analysis: Global currency markets remained active as traders monitored central bank remarks, trade conditions, and economic sentiment across major regions.

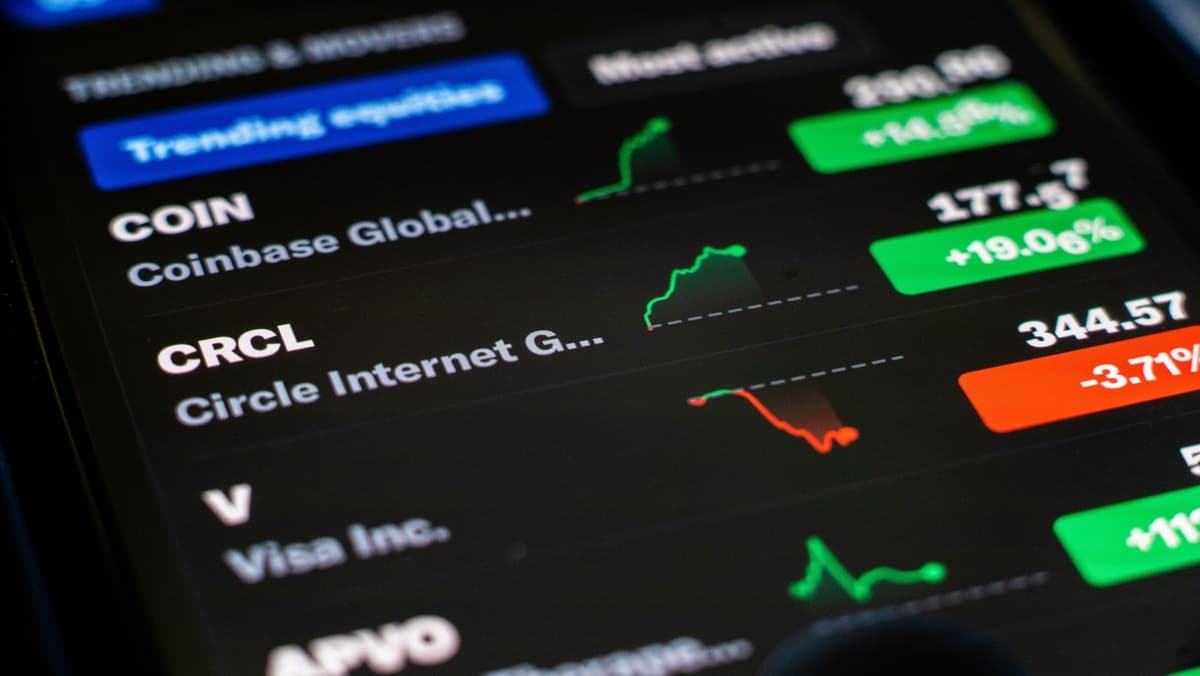
S&P 500 Index Analysis: The S&P 500 moved through a mixed trading environment as Wall Street reacted to fresh economic reports and shifting views surrounding monetary policy.
Rivian Stock Price Prediction 2030: The global automotive industry is undergoing one of the biggest transformations in modern economic history.
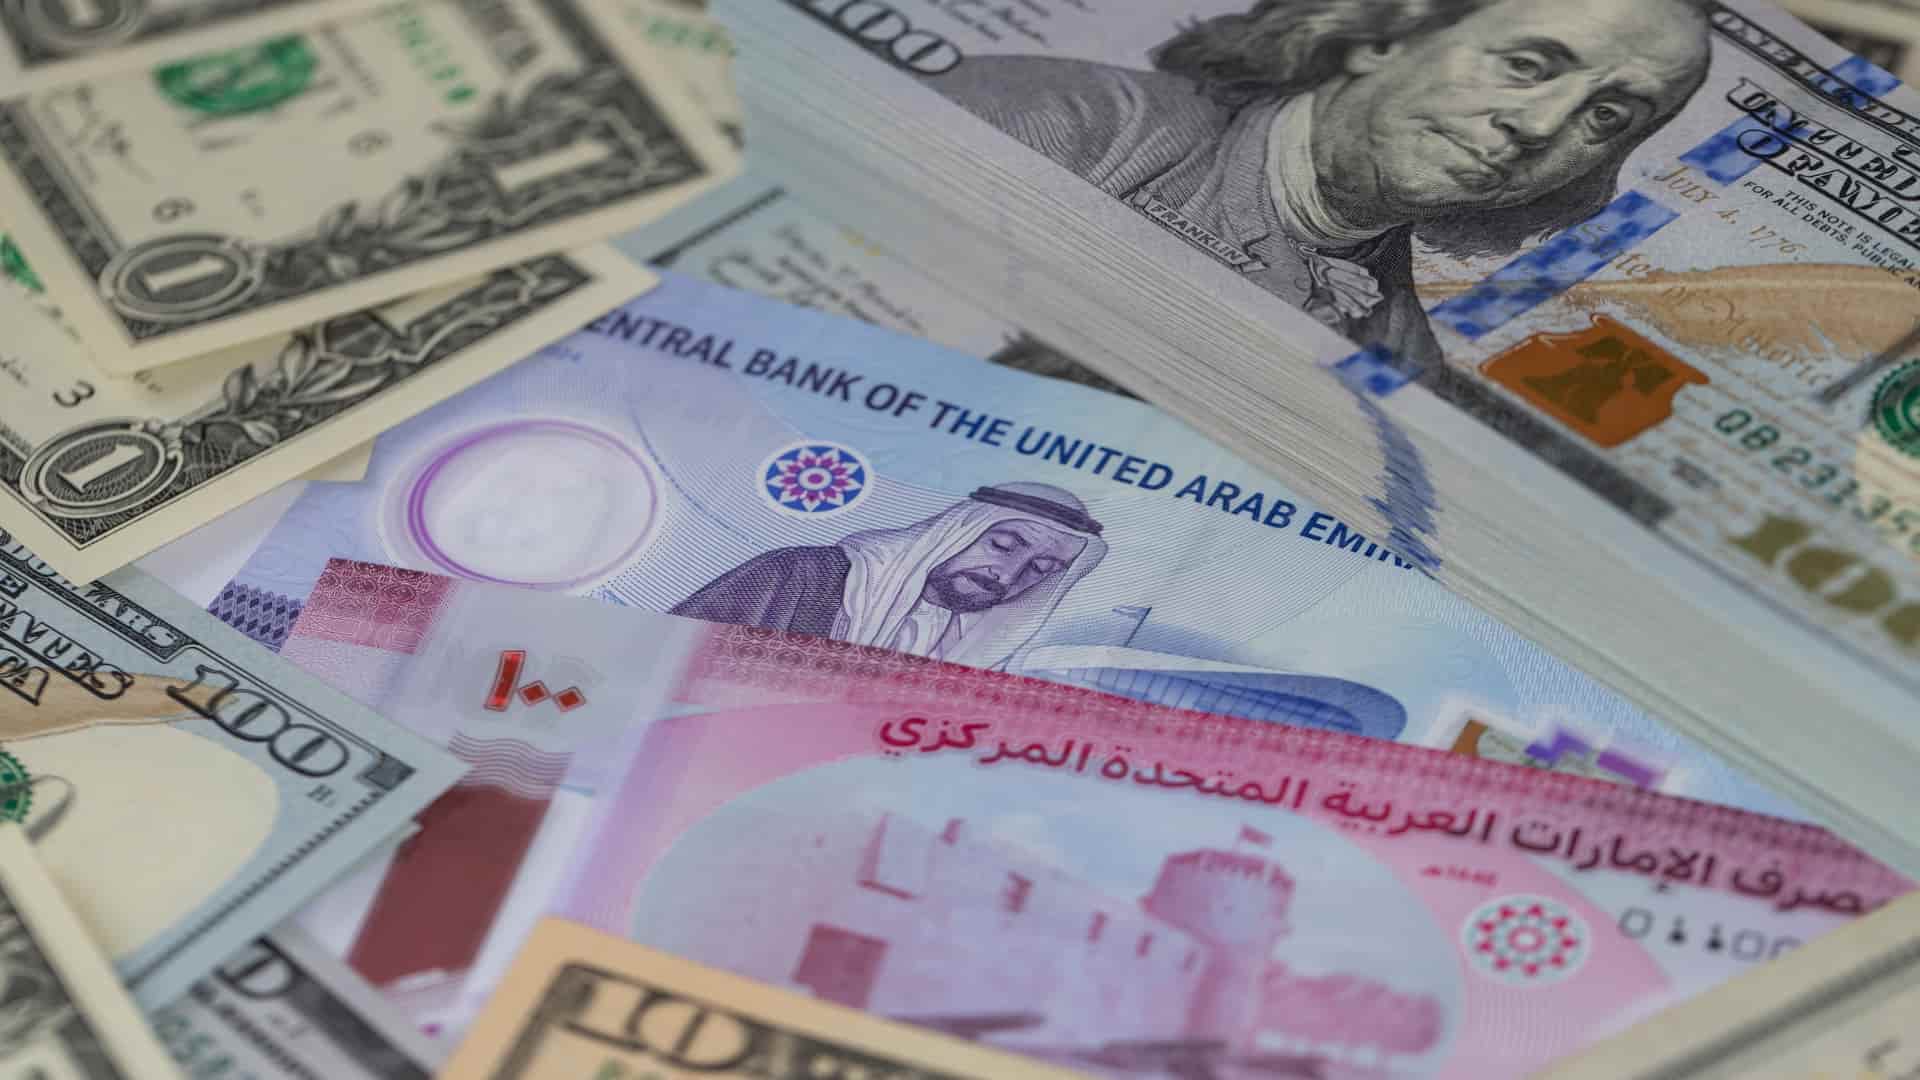
AED/USD Exchange Rate Analysis: The United Arab Emirates dirham (AED) has become one of the most stable currencies in the global foreign exchange market.
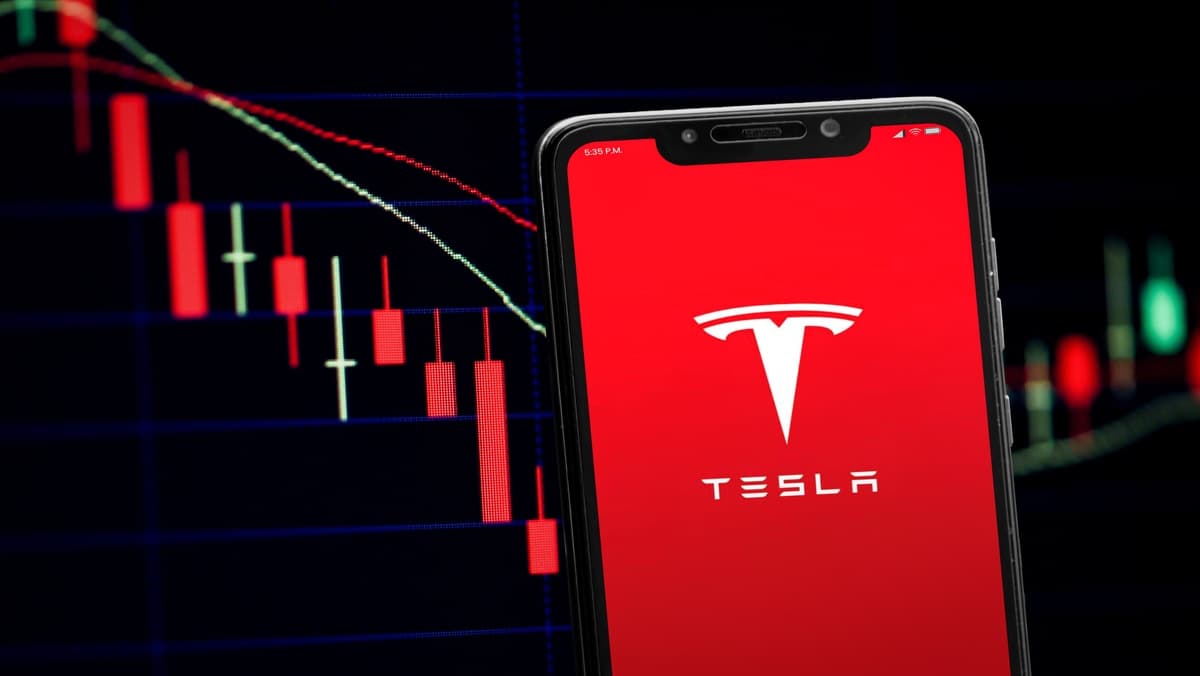
Tesla (NASDAQ:TSLA) stock is rising: The electric vehicle giant continues to dominate headlines as traders focus on artificial intelligence, autonomous driving technology, robotics, and future energy solutions.
Best CFD Brokers: Gold trading continues to hold a special place in the UAE’s financial markets, attracting traders who seek stability, liquidity, and opportunities during uncertain economic conditions.
Best CFD Brokers: Gold CFD trading has become one of the most popular ways for South African traders to access the global commodities market without owning physical bullion.

Markets.com Review 2026: The online trading industry has evolved dramatically over the last few years, and traders in 2026 expect much more from a broker than simple buy-and-sell functionality.

What is the UAE stock market index: The UAE has become one of the most influential financial centers in the Middle East.
Top 10 best ETFs to invest in South Africa: Exchange-traded funds, better known as ETFs, have become one of the fastest-growing investment products in South Africa.
Islamic Green Finance: Dubai Islamic Bank has strengthened its commitment to sustainable finance with the launch of a 500 million dollar green sukuk aimed at funding environmentally friendly projects.
Gold Price Today: Gold prices remained steady on May 29, with XAUUSD continuing to trade above the 4,500 level despite ongoing volatility across global financial markets.
The Johannesburg Stock Exchange entered May 2026 under pressure from global market uncertainty, fluctuating commodity prices, and cautious investor sentiment.
Learn what a Pivot Point is, how the pivot point formula works, and how traders use support and resistance levels in trading.
Learn the key differences between call and put options, with simple examples, breakeven rules, trading uses and key risks for beginners.
Learn why Starlink is central to SpaceX’s IPO, how it drives revenue, what risks investors may watch, and how traders can assess volatility.


