목요일 Oct 23 2025 10:17

7 분

What are Hammer Candlesticks in Trading: Candlestick patterns offer a visual representation of price movements and can provide traders with insights into potential market reversals or continuations.
Among these patterns, the hammer candlestick stands out for its ability to signal possible shifts in market sentiment. This article explores what hammer candlesticks are, why they matter, how they differ from similar patterns, and how to combine them with other indicators to enhance decision-making.
1. What is a Hammer Candlestick?
A hammer candlestick is a single-bar pattern characterized by a small body and a long lower shadow, with little or no upper shadow. This shape resembles a hammer, with the body at the top and the shadow hanging below like the handle.
The key features of a hammer candlestick include:
Small real body: The opening and closing prices are close to each other.
Long lower wick: The lower shadow is typically two to three times the length of the body.
Little or no upper wick: The upper shadow is minimal or absent.
This pattern commonly appears after a downward price move, suggesting that sellers pushed prices lower during the session, but buyers regained control by the close. The hammer can imply a potential reversal or pause in the prevailing trend.
Example: Imagine a market where prices have been falling steadily. A hammer candlestick forms as sellers drive the price down early, but buyers step in, pushing the price back near the session’s opening level. This buying pressure hints that the downtrend might be losing momentum.
2. Importance of Hammer Candlestick Chart
The hammer candlestick carries important information about market psychology. It signals that despite selling pressure, buyers have entered the market with enough force to push prices back up. This shift in sentiment can mark a turning point or indicate a temporary floor.
Reasons the hammer is important include:
Potential trend reversal: When seen after a downtrend, it can indicate that selling exhaustion is near, and buyers may take control.
Psychological clue: The long lower shadow reflects rejection of lower prices.
Entry signal: For those looking to enter long positions, a hammer can serve as a visual cue to watch for confirmation of a bounce or reversal.
Risk management: It helps in placing stop levels below the shadow, as a break below may negate the pattern.
While the hammer is a valuable tool, it should not be used in isolation. Confirmation from subsequent price action or other tools increases the reliability of the signal.

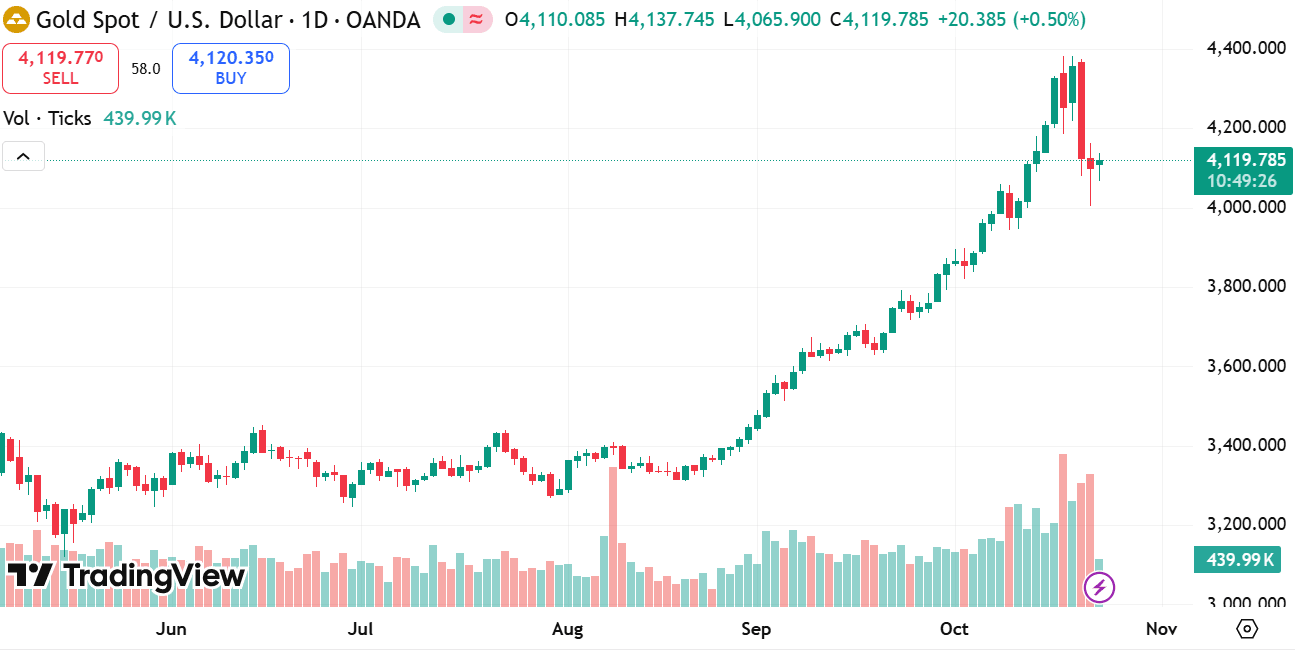
source: tradingview
3. The Difference Between Hammer Candlestick and Doji
Although both the hammer and doji candlesticks can signal indecision or potential reversals, they have distinct characteristics and implications.
Shape and structure:
A hammer has a small body near the top of the candle and a long lower shadow.
A doji has an extremely small body, often appearing as a thin line, with shadows extending above and below depending on the type.
Market context:
The hammer typically appears after a decline, indicating a rejection of lower prices.
A doji reflects indecision, where neither buyers nor sellers have a clear advantage.
Interpretation:
The hammer shows that buyers fought back within the session, hinting at a possible reversal.
The doji represents balance and uncertainty and requires more confirmation to indicate a shift.
Example: After a downward move, a hammer forms, showing buyers regained control. Following the hammer, if the next candle closes higher, it strengthens the reversal signal. Conversely, a doji appearing in the same spot suggests hesitation, and traders often wait for further clues before acting.
4. The Difference Between Hammer Candlestick and Hanging Man
The hammer and hanging man look identical in shape but differ in their position within the trend and their implications.
Trend context:
A hammer forms after a downtrend and suggests a potential bullish reversal.
A hanging man appears after an uptrend and warns of a possible bearish reversal.
Psychological meaning:
The hammer signals that sellers pushed prices lower, but buyers fought back strongly.
The hanging man indicates that sellers tried to enter the market, creating selling pressure despite an overall uptrend.
Confirmation:
Both patterns require confirmation from the next candle for reliability.
A hammer confirmed by a higher close after it points to a shift upward.
A hanging man confirmed by a lower close after it signals a potential decline.
Example: Suppose prices have been climbing steadily, then a hanging man candlestick appears, showing sellers challenged the upward momentum. If the next candle closes lower, it suggests buyers may be losing control. In contrast, a hammer in a downtrend, followed by a higher close, suggests buyers are gaining strength.
5. Integrating Other Indicators with Hammer Candlesticks
Using hammer candlesticks alongside other market tools enhances decision-making and reduces false signals. Here are some ways to combine hammers with additional indicators:
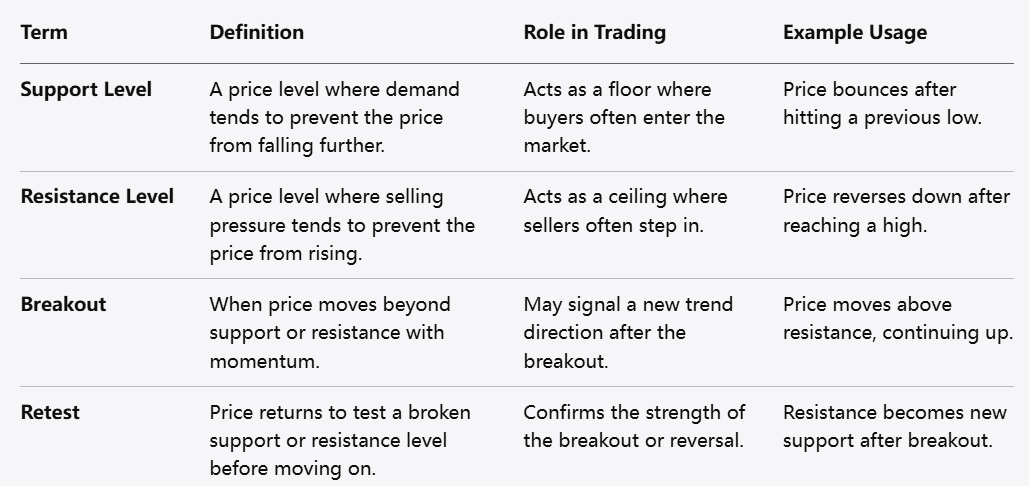
Support and Resistance Levels
A hammer near a well-established support level is more meaningful. The support area adds context, showing where buyers might naturally step in, reinforcing the hammer’s message.
Example: If a hammer forms at a previous low, this convergence suggests a stronger chance that the price will bounce.
Volume Confirmation
Increased trading volume during the hammer’s formation indicates stronger conviction behind the buying pressure. High volume supports the idea that the market is shifting.
Example: A hammer appearing with above-average volume implies many participants are involved, strengthening the reversal potential.

Moving Averages
Aligning hammer signals with moving averages can help identify trend direction and filter trades. For instance, a hammer appearing near a long-term moving average used as dynamic support may provide a timing edge.
Example: If a hammer forms just above a rising moving average, this confluence could signal that the trend remains intact and the pullback is ending.
Momentum Indicators
Oscillators such as the Relative Strength Index (RSI) or Stochastic indicators can highlight oversold conditions, complementing the hammer’s reversal implication.
Example: A hammer forming when RSI is in oversold territory suggests the selling pressure might be exhausted, increasing the likelihood of a bounce.

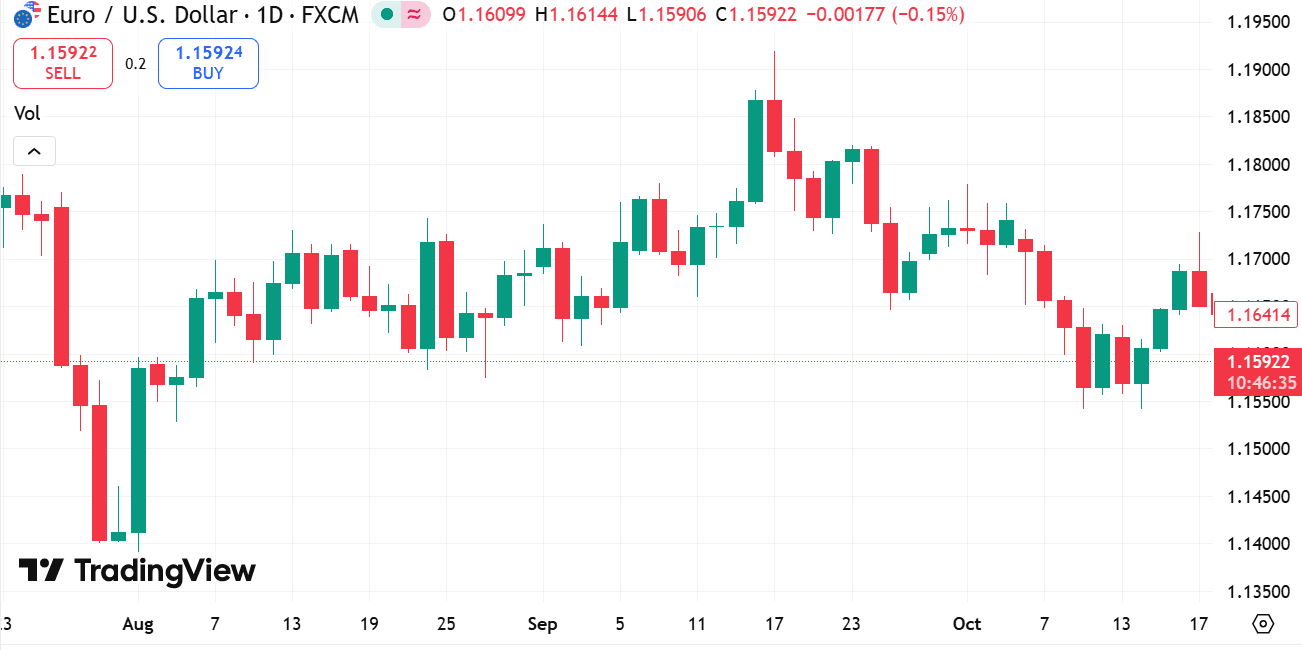
source: tradingview
Candlestick Confirmation
Wait for the candle following the hammer to close higher to confirm the reversal signal. This practice helps avoid false positives.
Example: After a hammer forms, the next candle closing above the hammer’s close reaffirms buying interest.
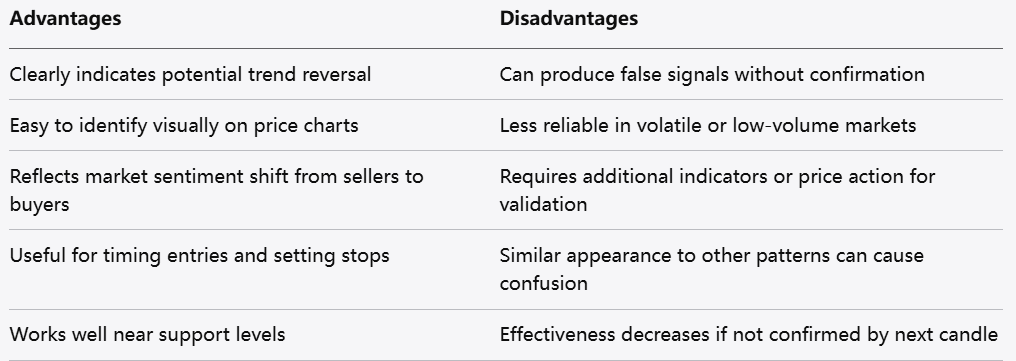
There are some advantages and disadvantages of the Hammer Candlestick pattern

Conclusion
Hammer candlesticks are powerful visual tools that highlight potential turning points in price action. Recognizing the pattern’s shape, context, and psychology can aid in understanding market shifts. Differentiating hammers from similar candlesticks like dojis and hanging men is crucial for accurate interpretation.
Integrating hammer candlestick signals with other tools—such as support levels, volume, moving averages, and momentum indicators—provides a more comprehensive view and improves the quality of trading decisions. Remember, no single signal guarantees an outcome, but combining multiple clues helps navigate the market’s complexities more effectively.
By carefully observing hammer candlesticks and confirming their signals through additional indicators, traders can enhance their ability to anticipate changes and manage risk thoughtfully.
Risk Warning and Disclaimer: This article represents only the author’s views and is for reference only. It does not constitute investment advice or financial guidance, nor does it represent the stance of the Markets.com platform. Trading Contracts for Difference (CFDs) involves high leverage and significant risks. Before making any trading decisions, we recommend consulting a professional financial advisor to assess your financial situation and risk tolerance. Any trading decisions based on this article are at your own risk.