

Analyze the latest USD/JPY forecast as the pair consolidates near 161.60. Discover how BoJ policy friction, US-Japan yield spreads, and intervention risks impact trading.

Discover the 5-year crude oil price forecast through 2030. Explore how geopolitical risks, structural oversupply, and energy transition impact market trends.
SpaceX stock forecast for 2027, 2031 and 2036, covering IPO momentum, lockup risks, options activity, ETF demand, valuation and long-term growth scenarios.
USD/CAD holds near 1.4000 as weaker oil prices pressure the Canadian dollar, while Fed policy risk and overbought RSI shape the technical outlook.

Analysis of how Kevin Warsh’s possible shift away from Fed dot-plot guidance could affect Bitcoin, liquidity, risk appetite and long-term crypto sentiment.
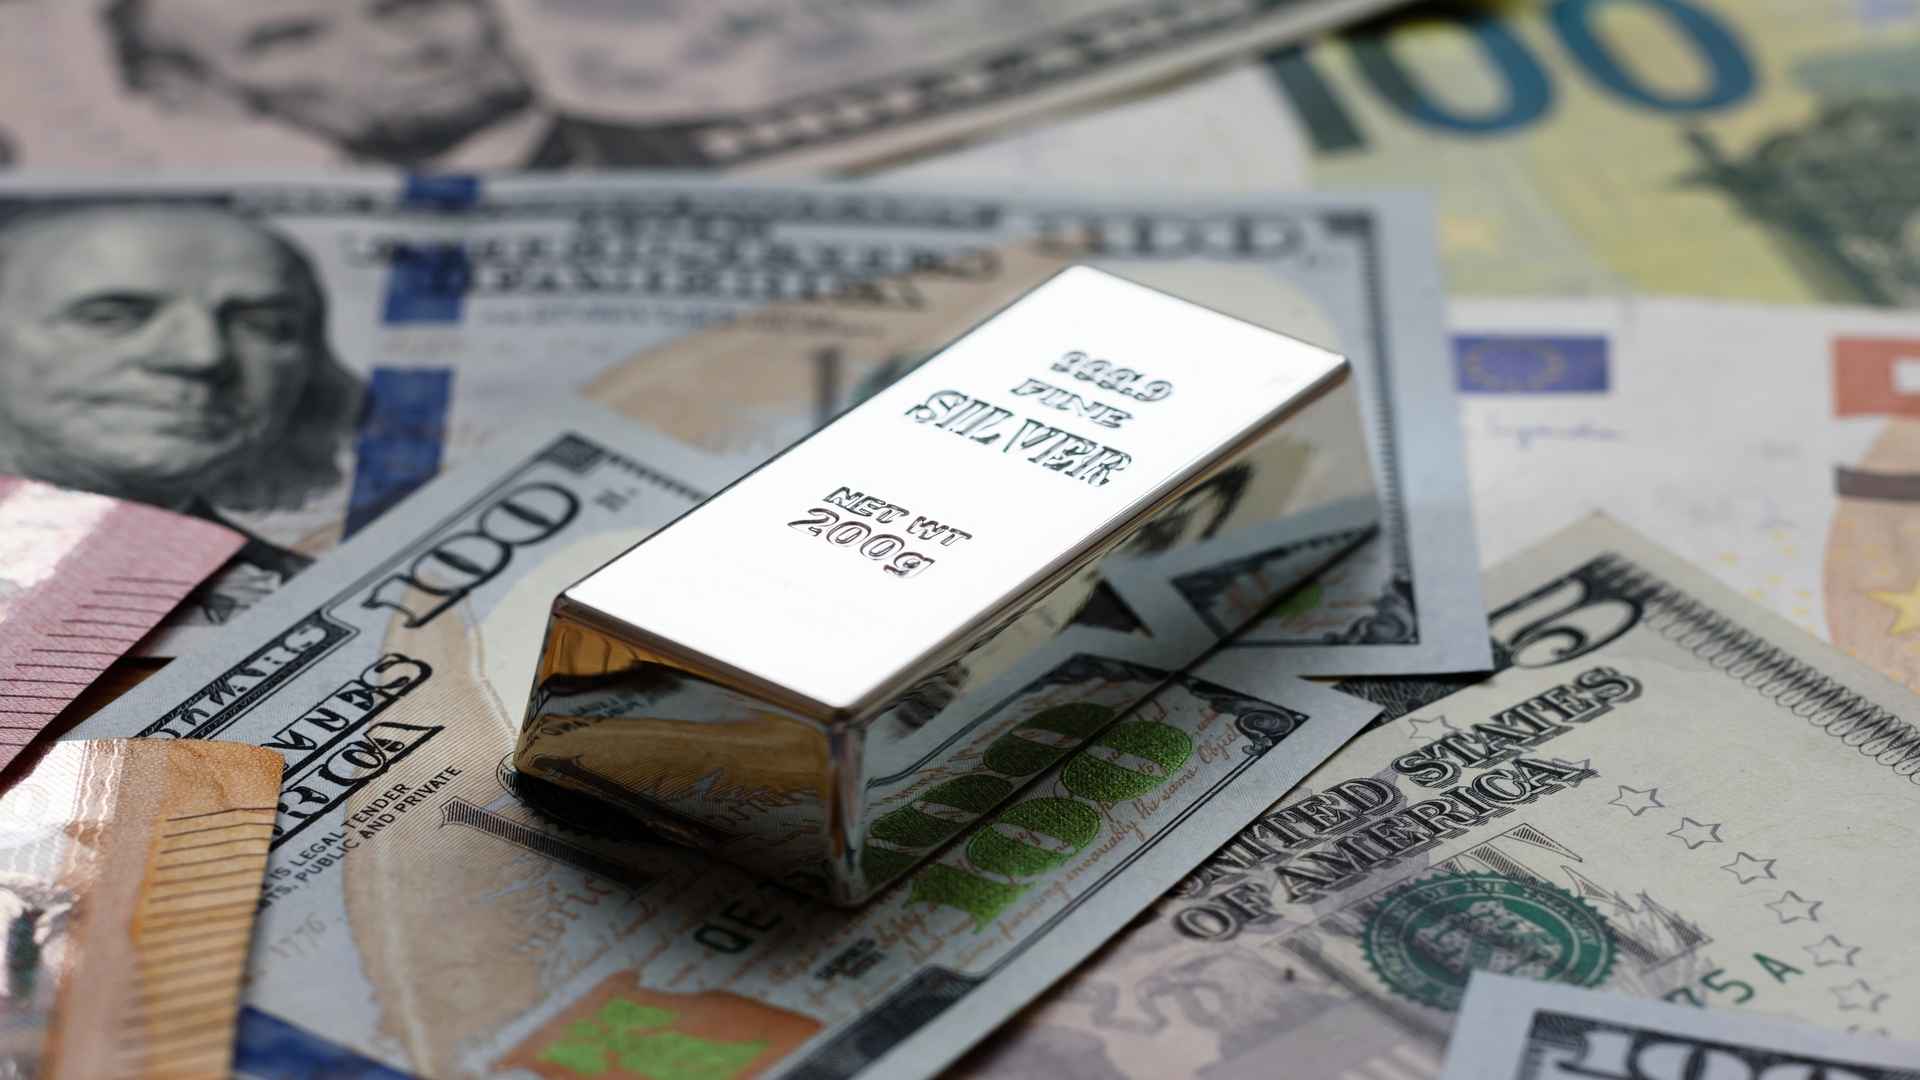
An in-depth analysis of the XAG/USD silver price forecast, exploring the impact of the US-Iran peace framework, Fed rate decisions, and crucial technical levels.
EUR/USD trades near 1.1580 as the Dollar strengthens before the Fed decision, while ECB inflation risks and key technical levels remain in focus.
Read our in-depth analysis of the June 2026 FOMC meeting under new Fed Chair Kevin Warsh. Discover how the removal of forward guidance and a hawkish dot plot impact USD, EUR, and JPY.

Japan and South Korea stocks recovered from early losses, with the Nikkei hitting a fresh record high and KOSPI rising over 1.5% as chip shares rebounded.
SpaceX (SPCX) closed +19% on debut and is now the 6th-largest US company inside the Nasdaq 100. Here are 5 ways South African CFD traders can trade the aftermath in ZAR via Markets.com.

A practical, step-by-step guide for South African traders: how to trade the SpaceX (SPCX) IPO using CFDs in rand. Long vs short, leverage, margin, spreads, stops and demo trading on Markets.com.

SpaceX’s expected IPO raises questions over S&P 500 and Nasdaq-100 inclusion as investors assess index rules, profitability and valuation risk.

KOSPI Index shows momentum weakness ahead of Micron earnings, with semiconductor sentiment fragile and AI chip demand expectations in focus. Key Takeaways

Gold prices fall toward the $4,000 level as a stronger US dollar and hawkish Federal Reserve expectations outweigh lingering US-Iran geopolitical risks. Read the full market analysis.

WTI crude holds near $72.50 after hitting a three-month low as easing Strait of Hormuz risks, rising UAE exports and Iran waivers lift global supply outlook.

Compare the best swap-free account CFD brokers in Dubai for 2026. See our top 11 picks, UAE regulation, fees, pros and cons, and how to open an account.

The best swap-free account CFD brokers in 2026, compared. See our top 11 picks for interest-free trading, what to look for, fees, and how to choose.

Who can open a swap-free account? You don't have to be Muslim. Learn the eligibility rules, what brokers ask for, and why non-Muslim traders use one too.


