


Which Broker Is Best in the UAE: The UAE has become one of the fastest-growing trading hubs in the Middle East, attracting both beginner and professional investors looking for access to forex, CFDs, stocks, commodities, and cryptos.

SOUN stock analysis: SoundHound AI has expanded beyond its original identity as a voice-recognition company.

Silver price XAGUSD forecast: Silver has become one of the most closely watched assets in global financial markets.
UAE stock market analysis: The United Arab Emirates has transformed into one of the most influential financial hubs in the Middle East.
How to invest in Bitcoin in South Africa: Bitcoin has become one of the most discussed financial assets in the world, and interest in cryptocurrency continues to grow across South Africa.
What is the best European stock to buy: European stocks are attracting global investors again as the continent produces several world-class companies with dominant positions in technology, healthcare, and defense.
Solana Price Prediction: Cryptocurrency markets move fast, but very few blockchain projects have developed as quickly as Solana.
Why South African Investors Love QQQ ETF: In recent years, South African investors have become increasingly interested in international investing.
Is Dubai using XRP: Dubai has positioned itself as one of the most crypto-friendly financial hubs in the world.
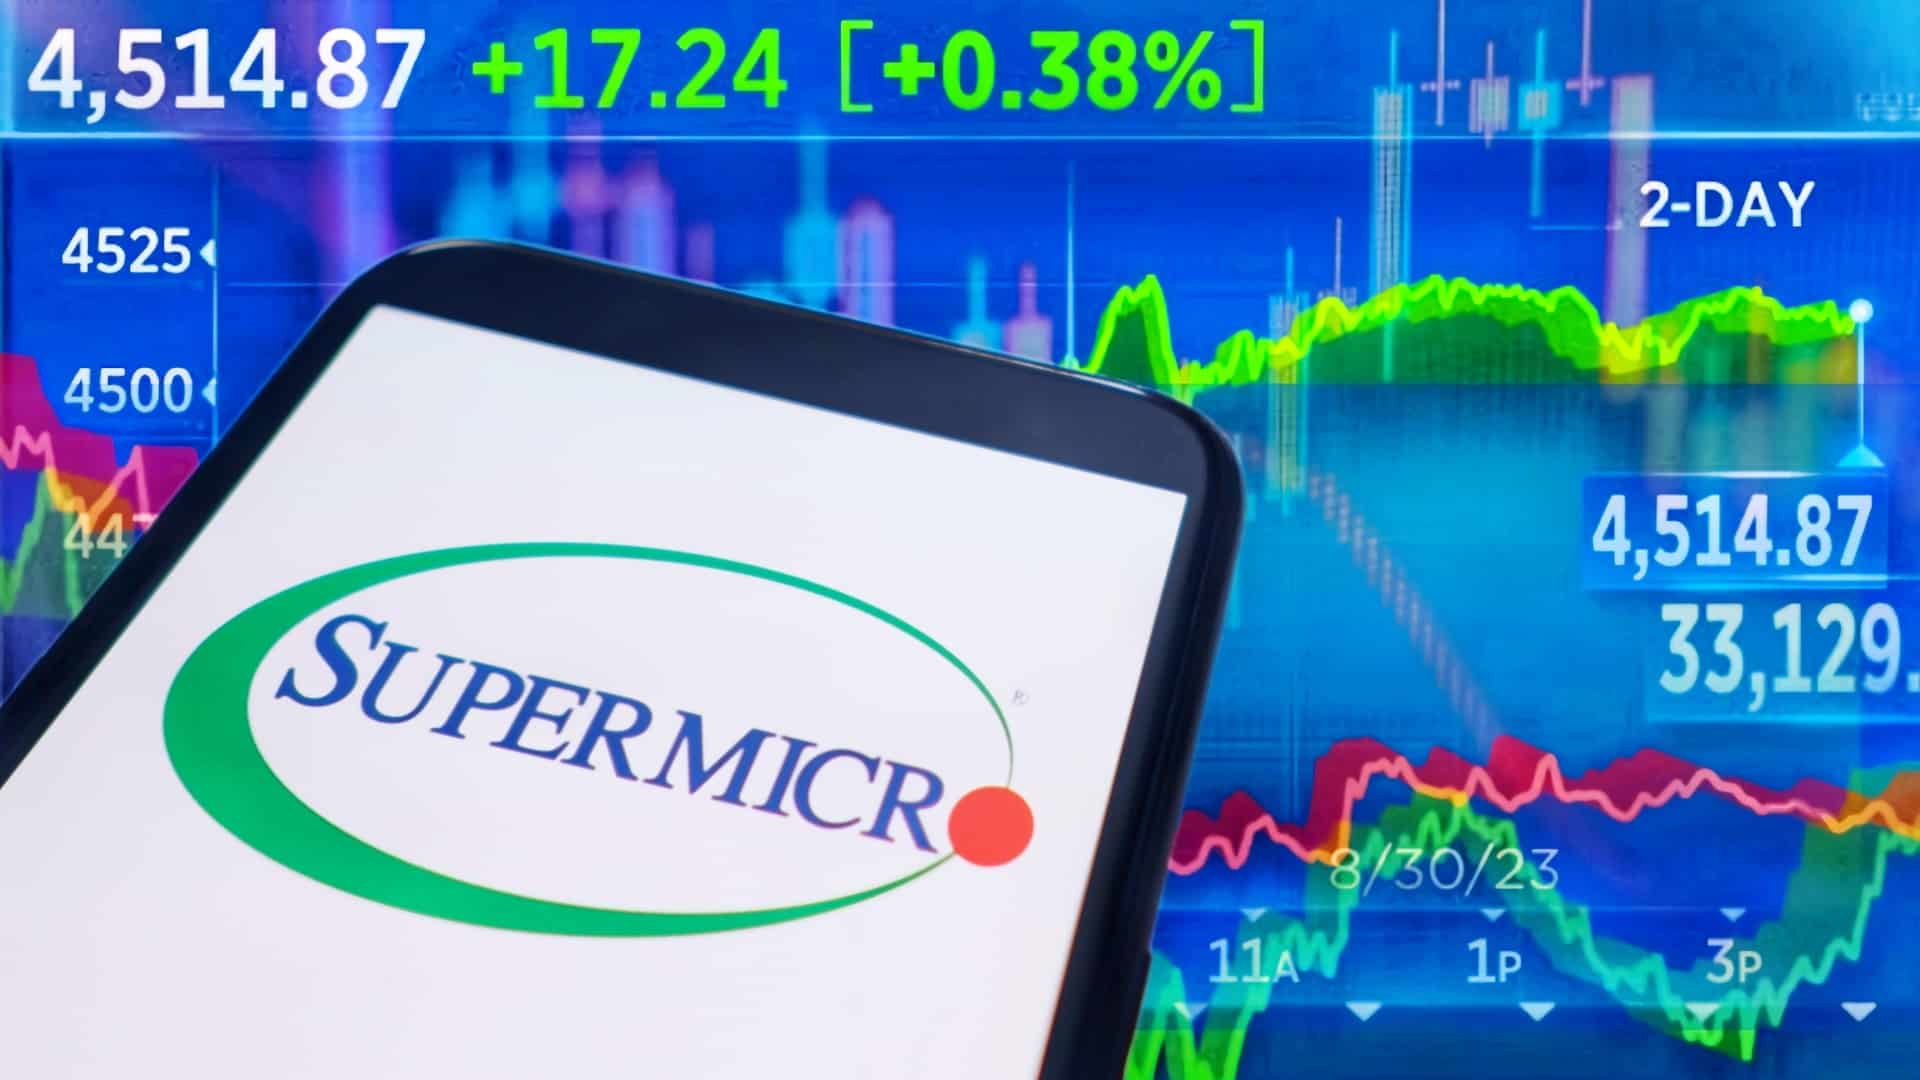
SMCI stock price target 2030: Super Micro Computer has become one of the most talked-about technology companies in the artificial intelligence boom.

Gold Price Prediction Next 5 Years: Gold has always been one of the most fascinating and influential assets in global financial markets.
MU stock forecast: Micron Technology has become one of the most important memory chip companies in the artificial intelligence era.

Gold Price Today: Gold prices remained trapped in a narrow range on May 15 as traders weighed the outlook for Federal Reserve policy and the broader direction of the global economy.
Korean Stock Market Crash: The South Korean stock market has staged a dramatic comeback after months of volatility and investor anxiety.
NVDA News Today: NVIDIA is expanding its presence across the artificial intelligence sector through a growing network of partnerships tied to cloud computing, telecom systems, robotics, and advanced infrastructure.
Learn what a bullish harami candle is, how the bullish harami pattern works, how traders confirm it, and how it may be used in CFD trading.

Learn the debenture definition, how debentures work, their main types, advantages, risks, and why they matter for investors and traders.

Learn the key differences between tokenized gold and physical gold, including ownership, storage, liquidity, risks, and gold trading options.


