

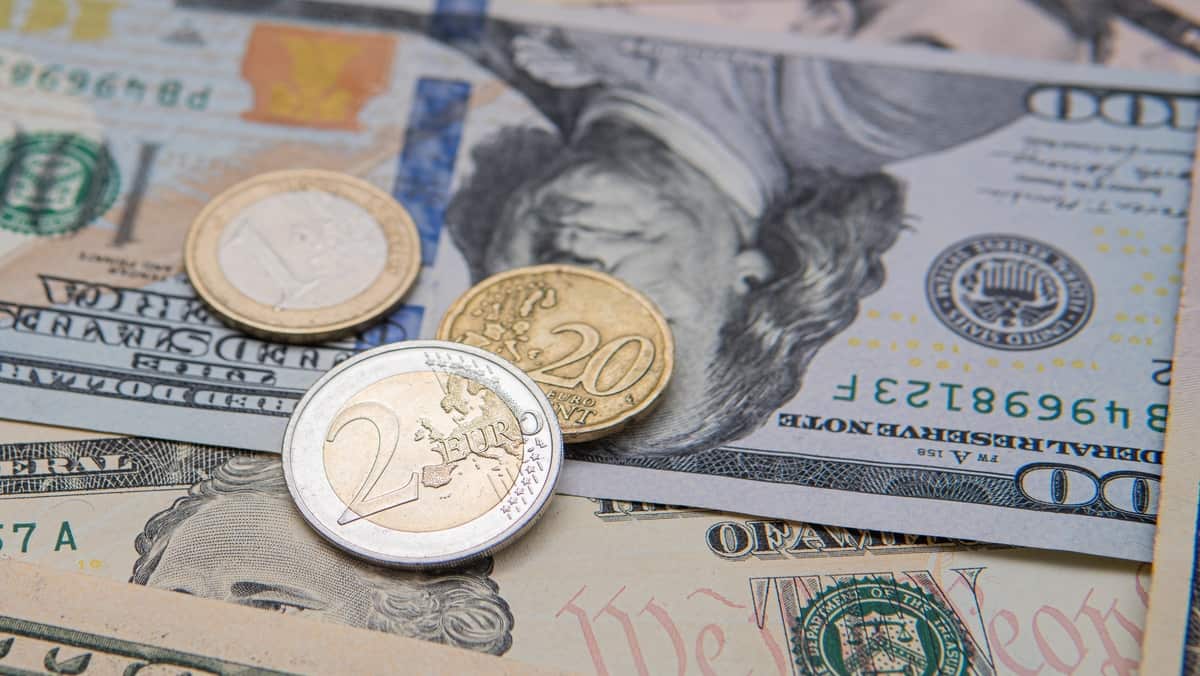
Forex Market Analysis: Global currency markets remained active as traders monitored central bank remarks, trade conditions, and economic sentiment across major regions.

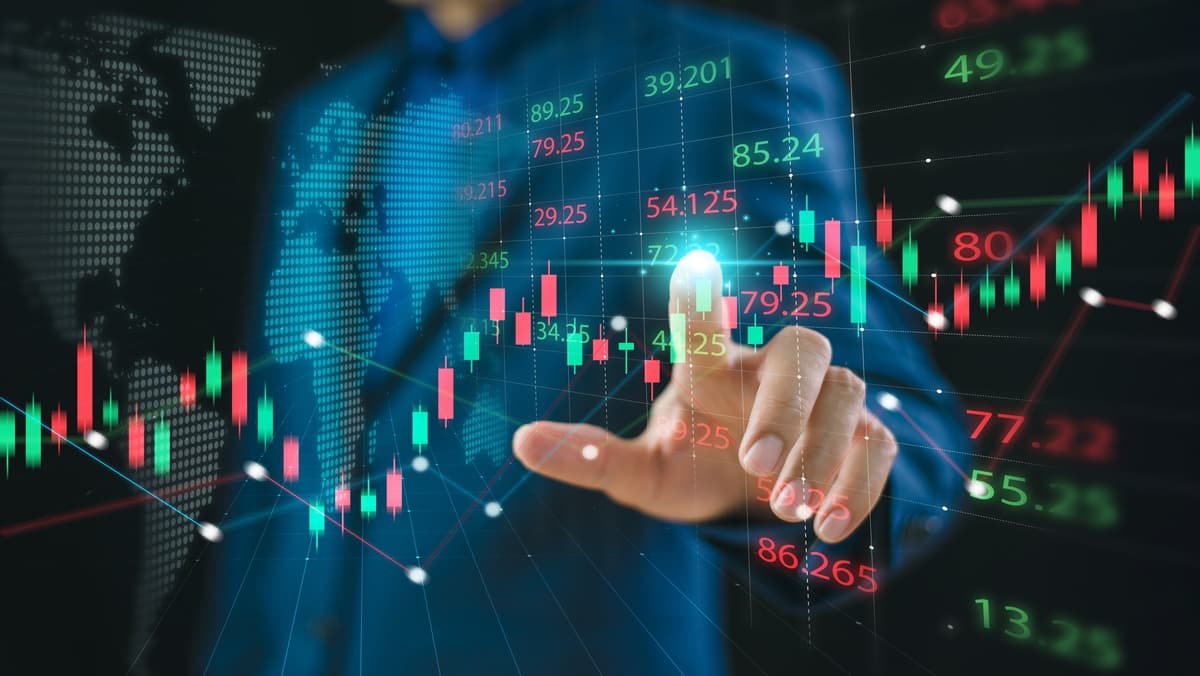
S&P 500 Index Analysis: The S&P 500 moved through a mixed trading environment as Wall Street reacted to fresh economic reports and shifting views surrounding monetary policy.

Rivian Stock Price Prediction 2030: The global automotive industry is undergoing one of the biggest transformations in modern economic history.
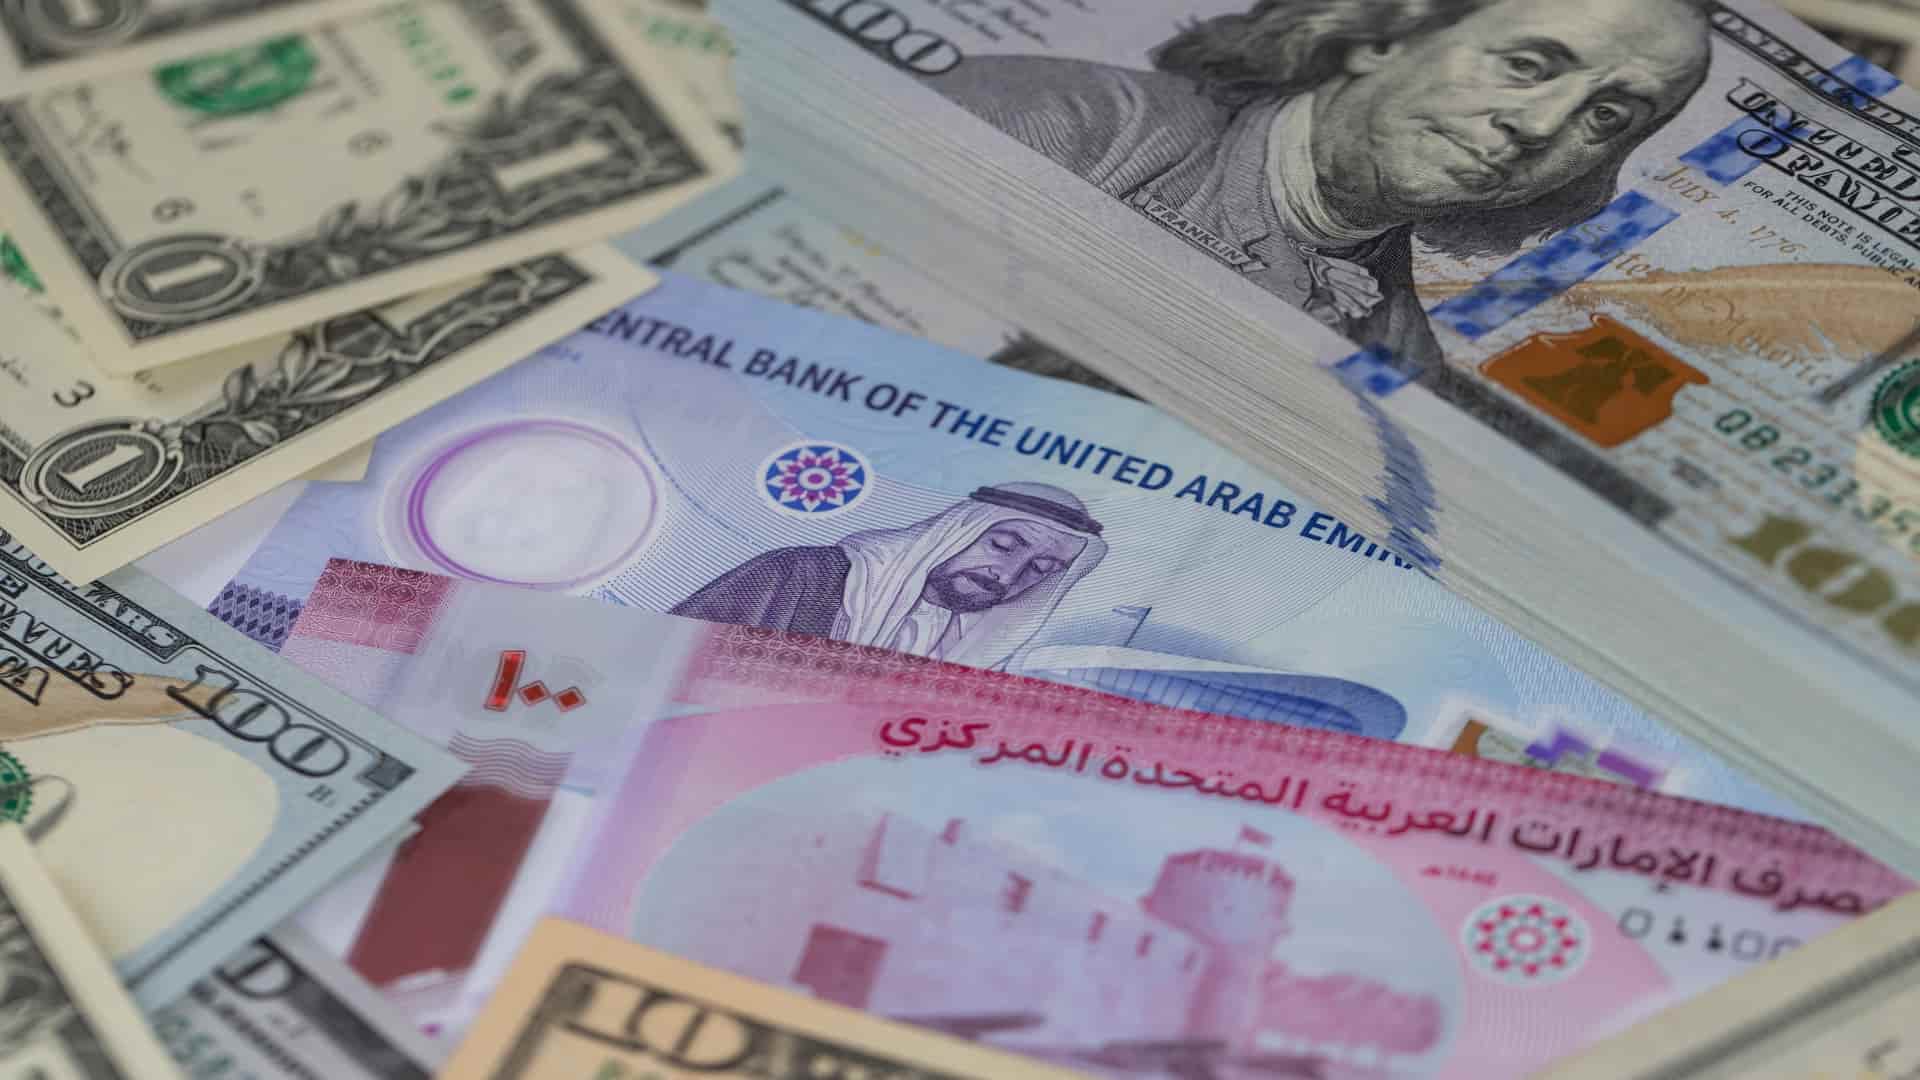
AED/USD Exchange Rate Analysis: The United Arab Emirates dirham (AED) has become one of the most stable currencies in the global foreign exchange market.
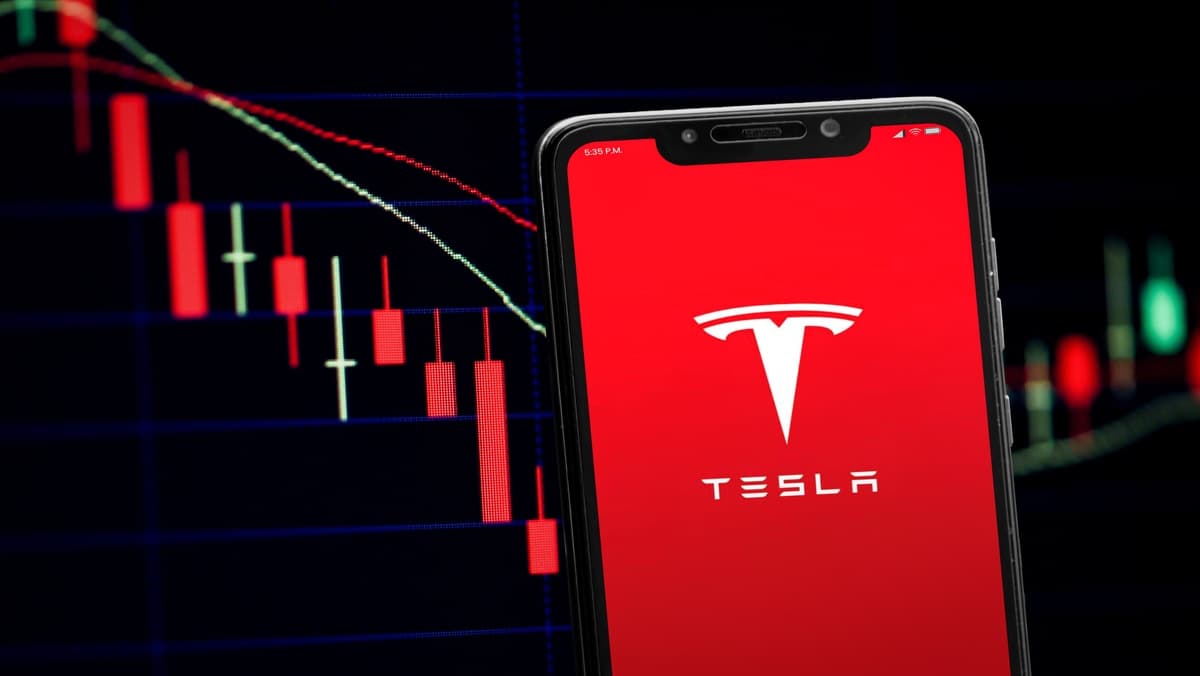
Tesla (NASDAQ:TSLA) stock is rising: The electric vehicle giant continues to dominate headlines as traders focus on artificial intelligence, autonomous driving technology, robotics, and future energy solutions.
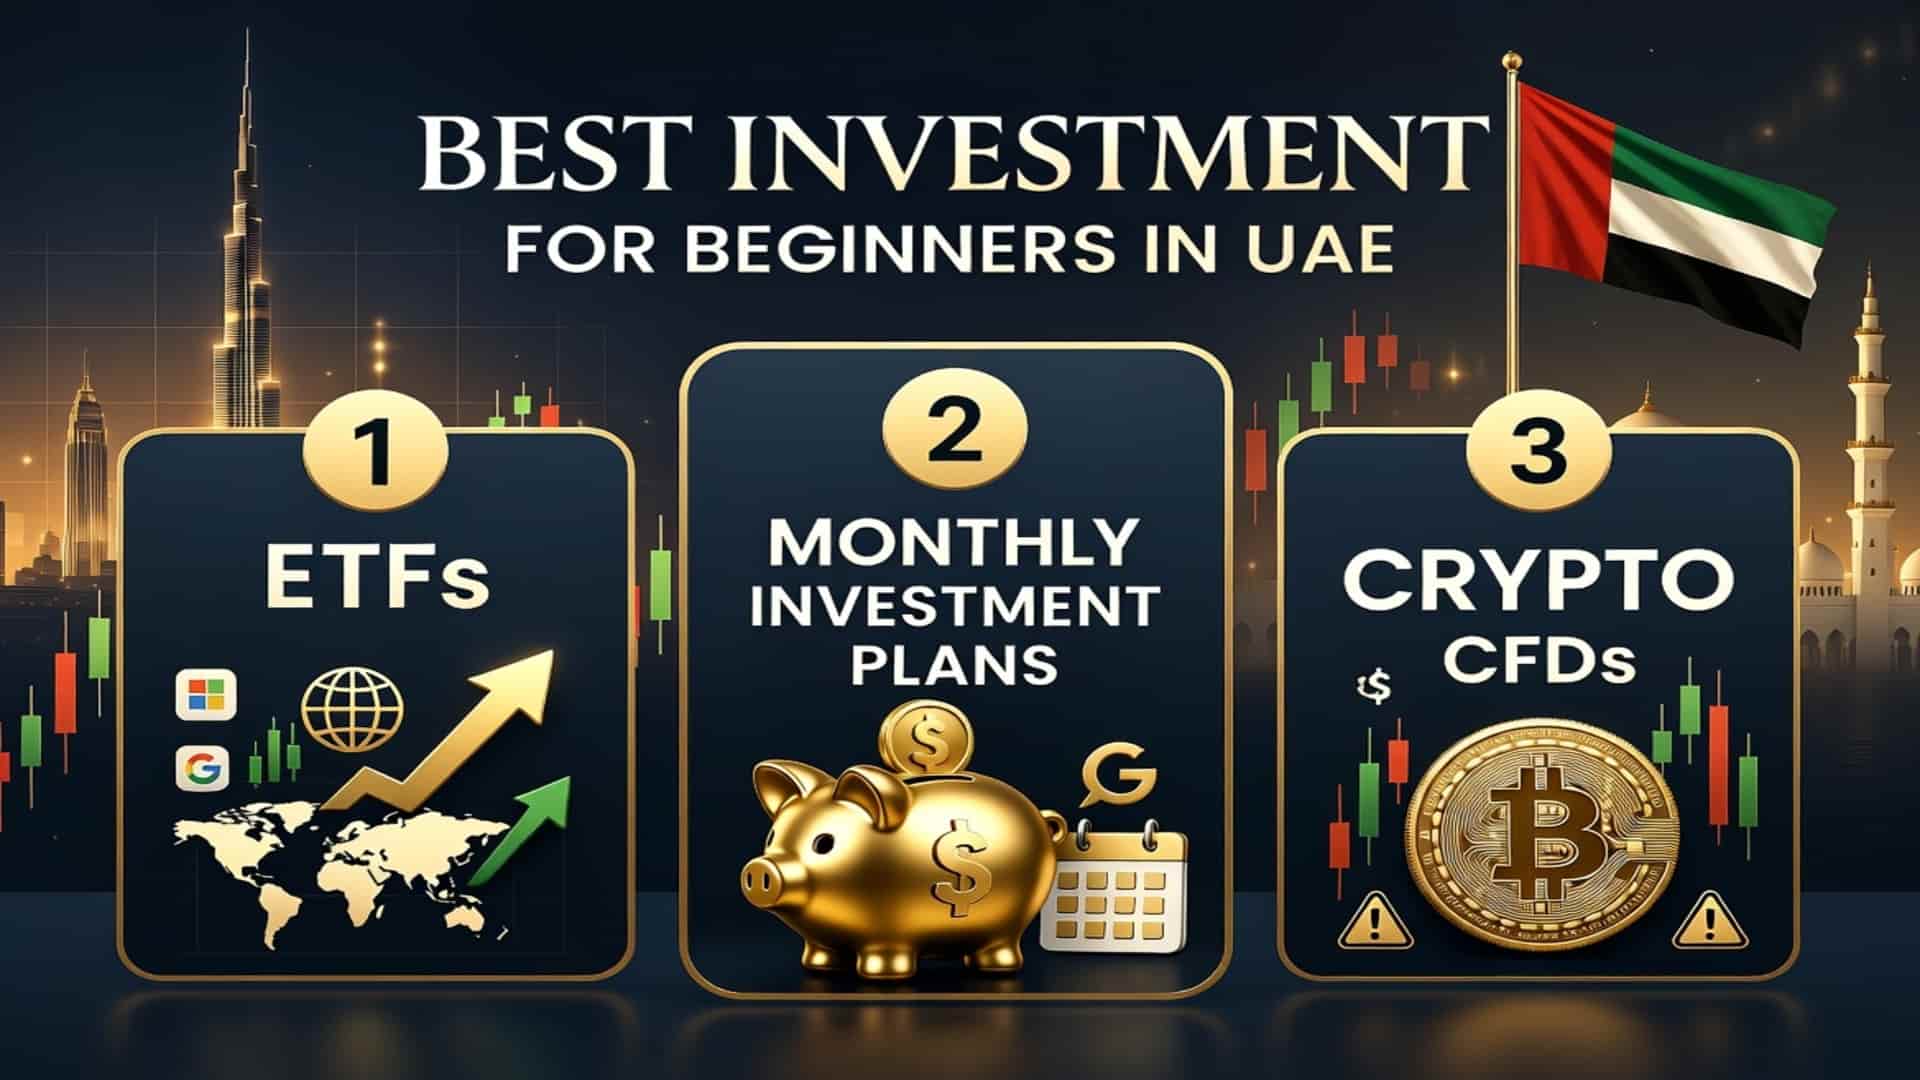
Best Investment in UAE For Beginners: The UAE has become one of the most dynamic financial centers in the Middle East, attracting a growing number of beginner investors.
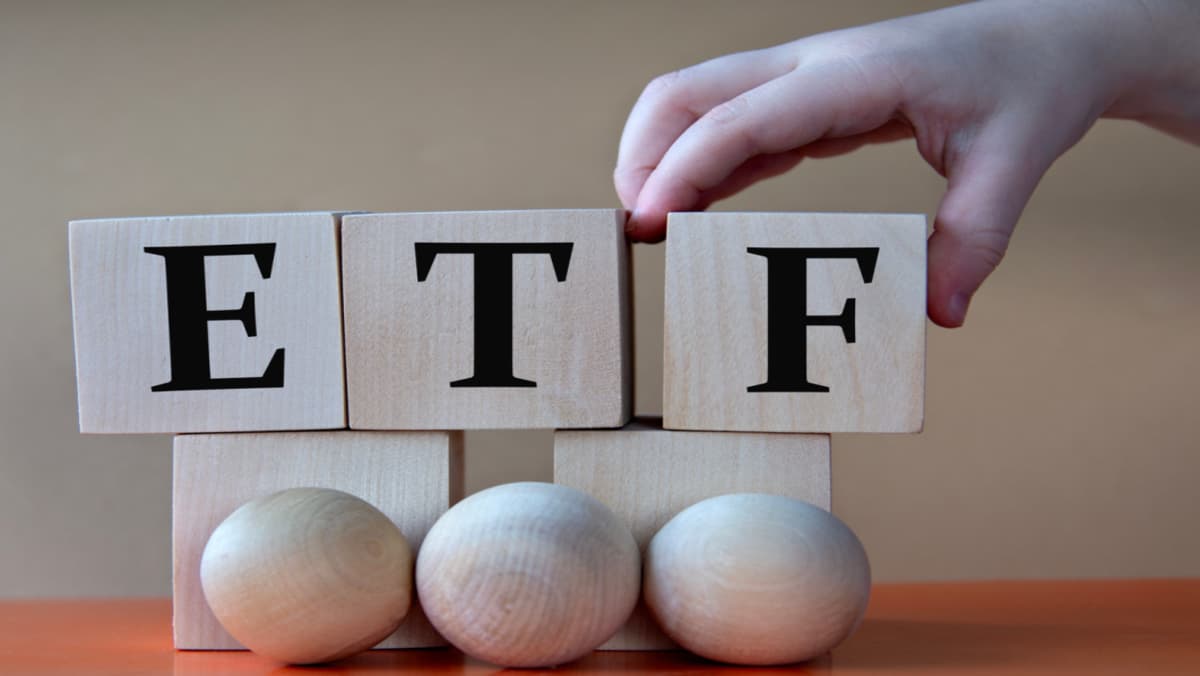
Global ETFs Introduction 2026: Through a single product, market participants gain exposure to industries, commodities, and corporate sectors spread across different regions.

Markets.com Review 2026: The online trading industry has evolved dramatically over the last few years, and traders in 2026 expect much more from a broker than simple buy-and-sell functionality.

What is the UAE stock market index: The UAE has become one of the most influential financial centers in the Middle East.
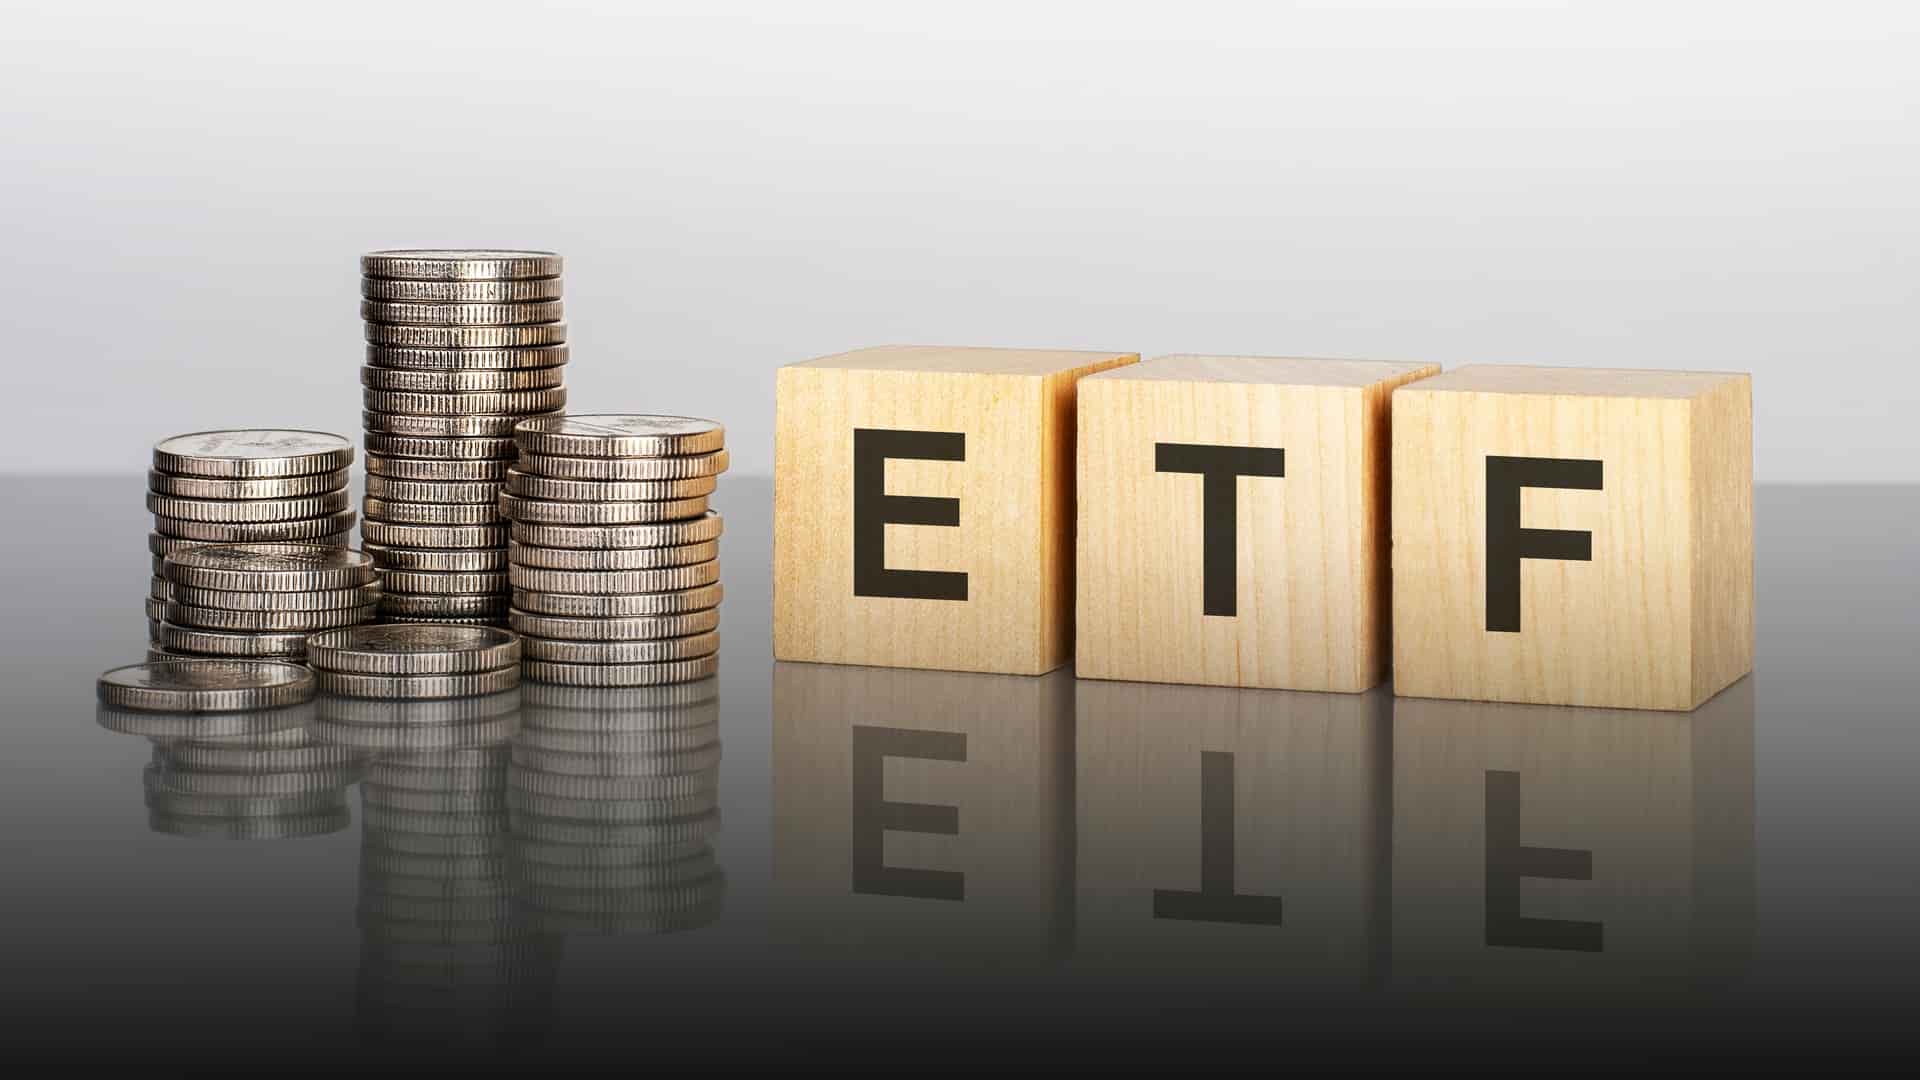
Top 10 best ETFs to invest in South Africa: Exchange-traded funds, better known as ETFs, have become one of the fastest-growing investment products in South Africa.

CFD Leverage Explained: CFD trading continues to grow rapidly in Dubai as more traders look for flexible ways to access global financial markets.

Which is the best trading platform in UAE for beginners: The United Arab Emirates has become one of the fastest-growing financial trading hubs in the Middle East.
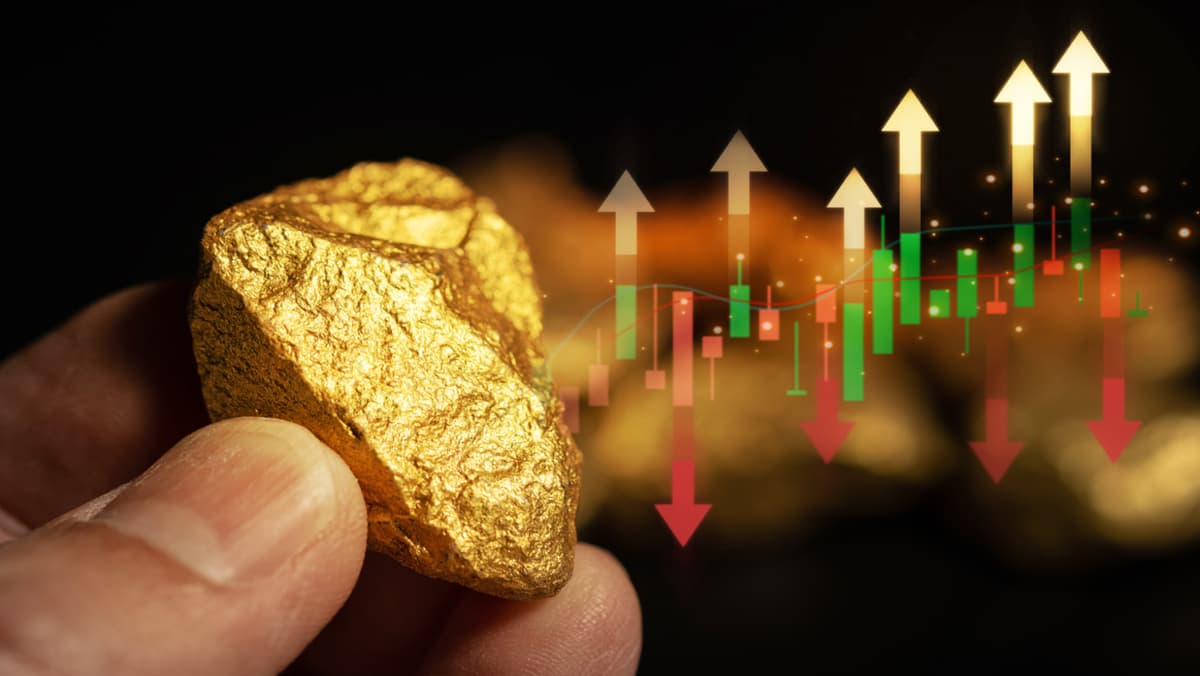
Gold Price Today: As of May 26, 2026, gold prices are trading steadily around the $4,540 per ounce mark.
SpaceX IPO Incoming: SpaceX is once again at the center of market speculation as discussions surrounding a possible IPO continue to grow.
Fed Leadership Change: The appointment of Kevin Warsh as the new leader of the Federal Reserve marks a major turning point for the American economy.
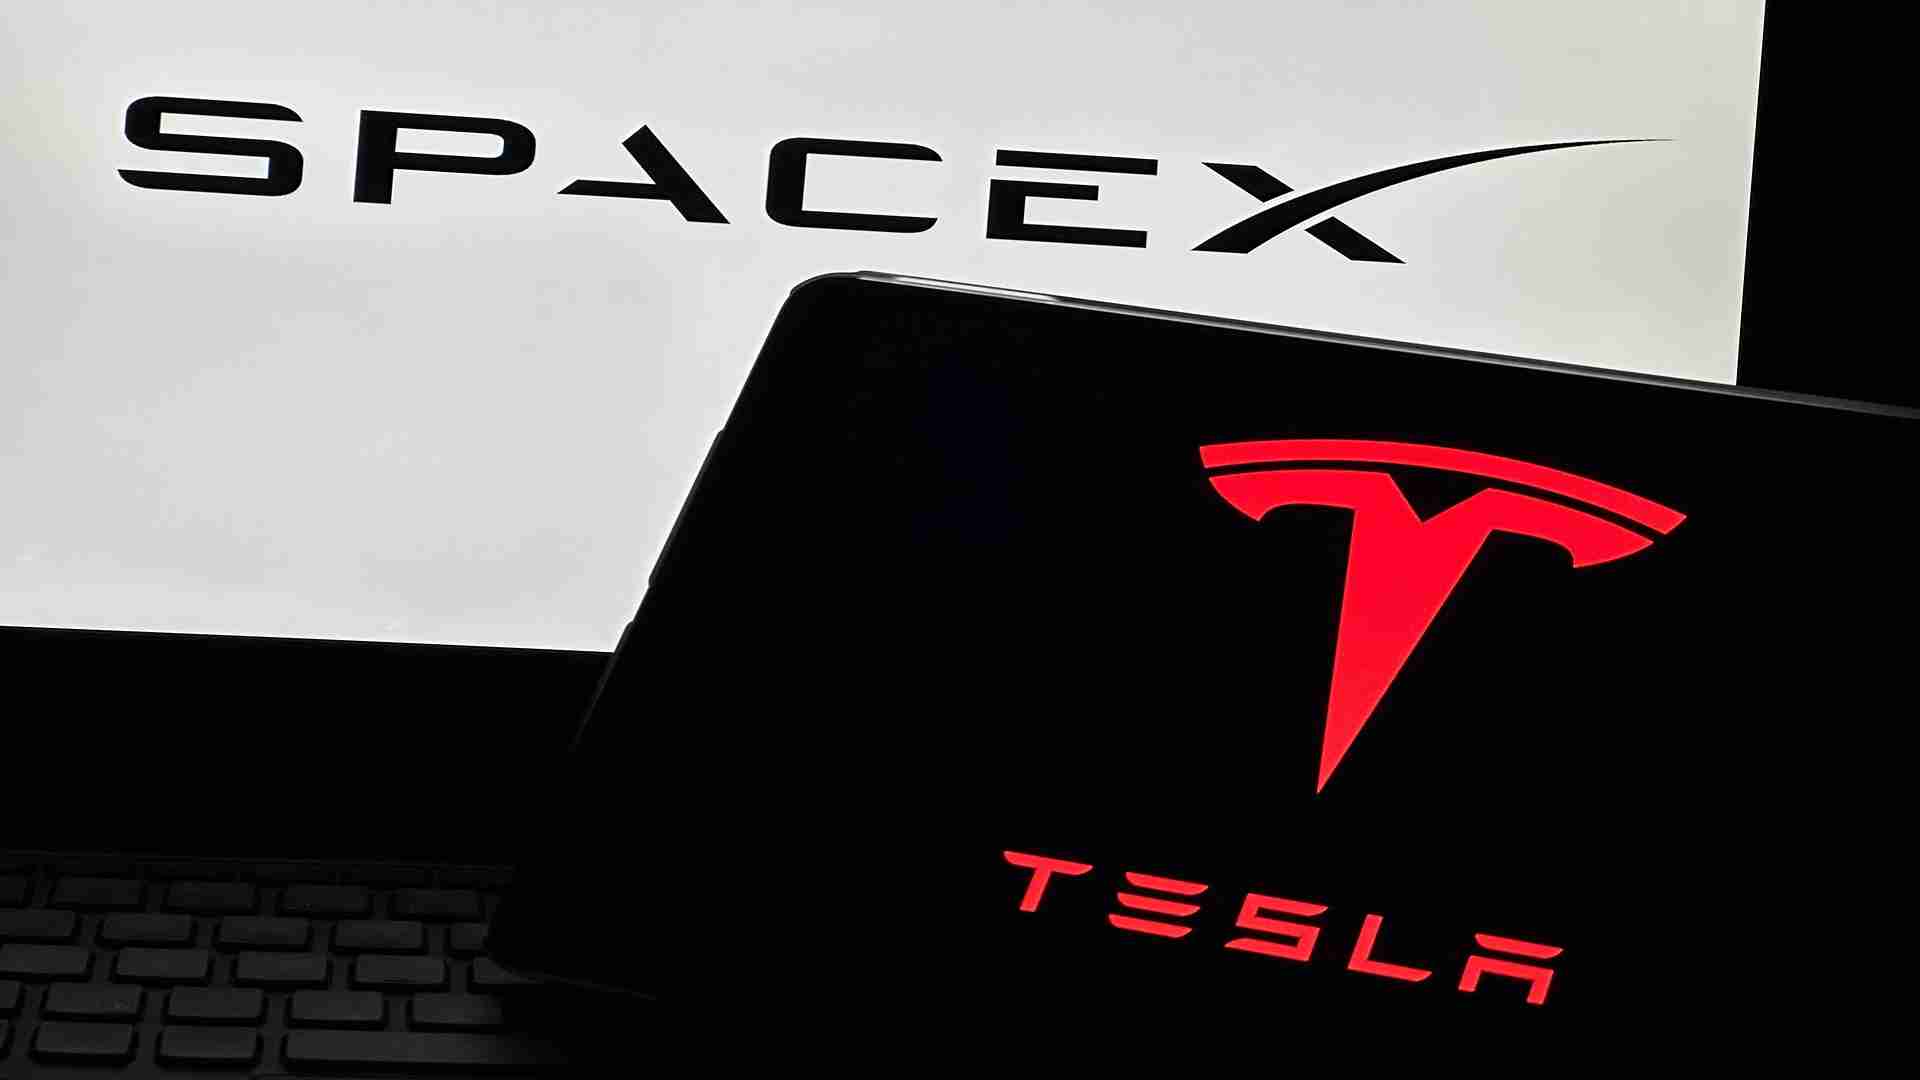
Compare Tesla Stock and SpaceX Stock, including access, valuation, IPO risks, liquidity, CFDs and key differences for traders.
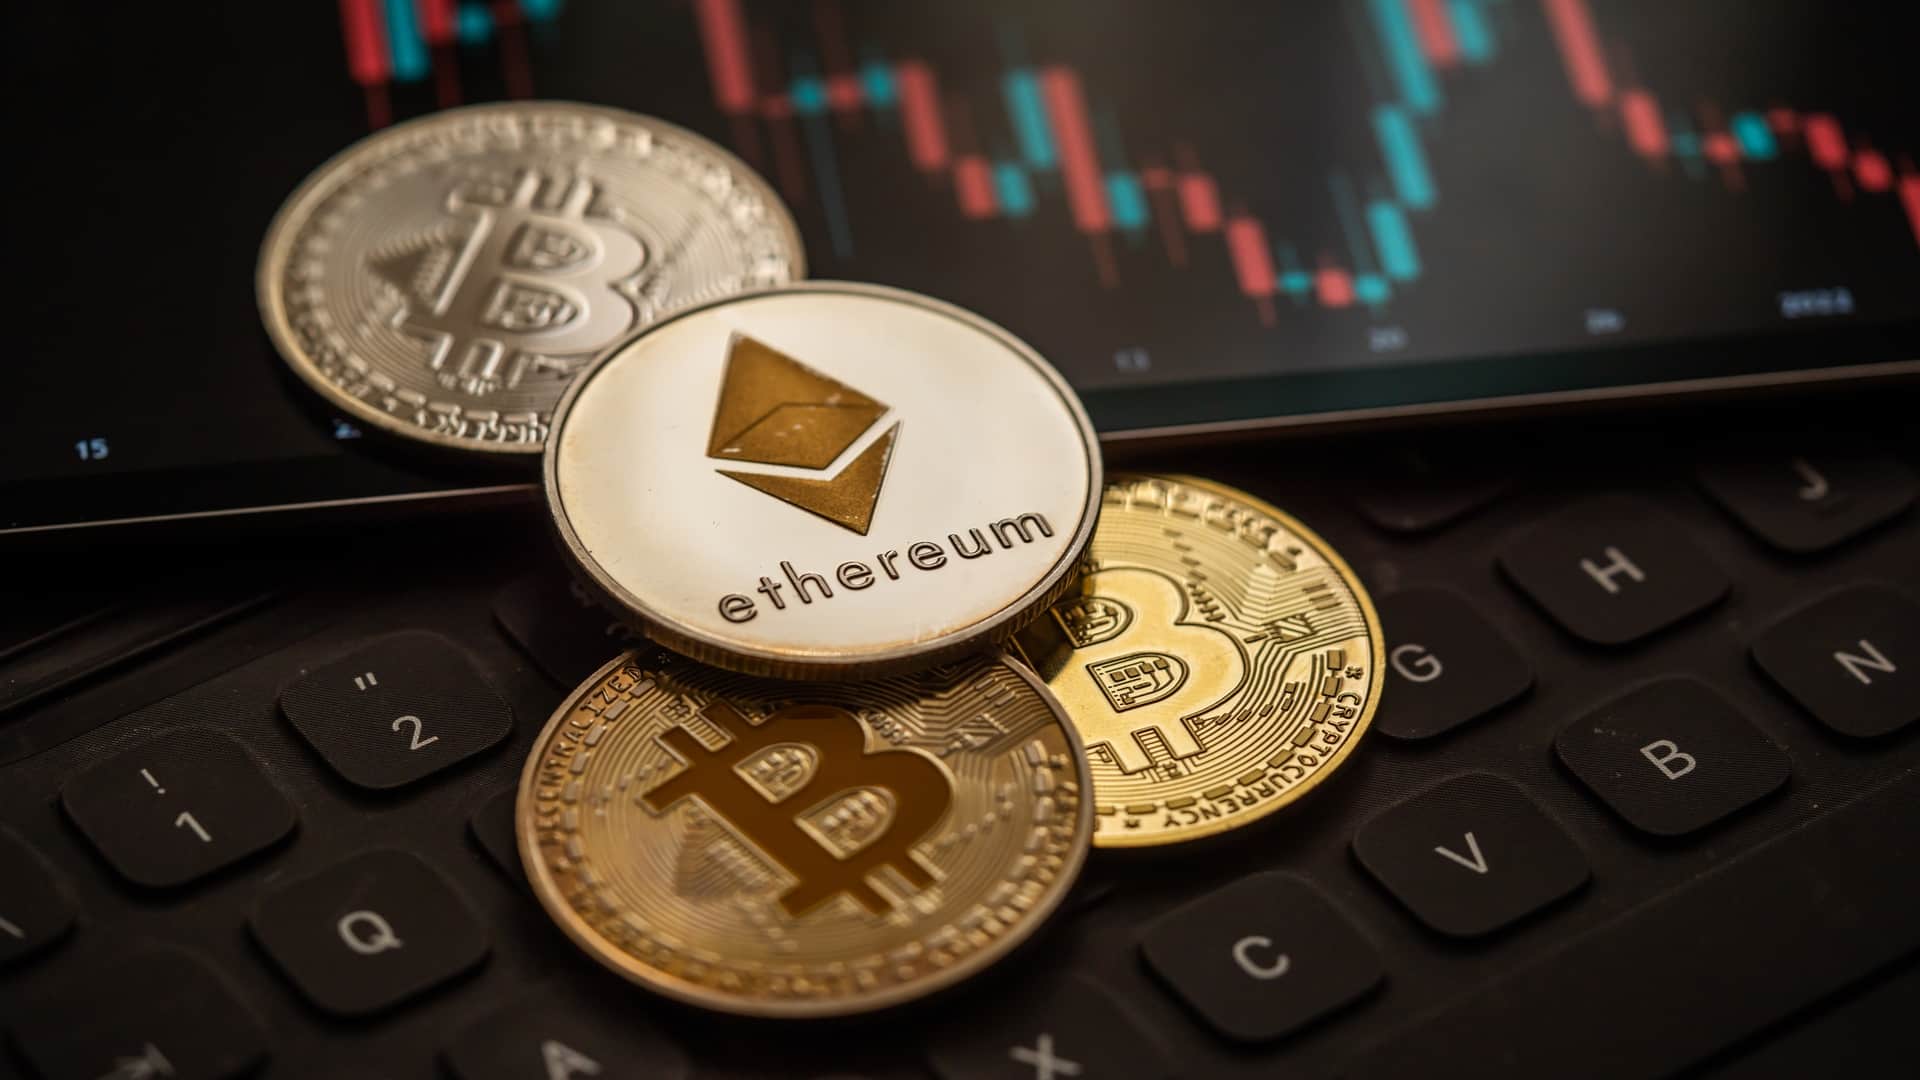
Learn what cryptocurrencies are, how blockchain works, what moves crypto prices, and how traders can approach the digital asset market.
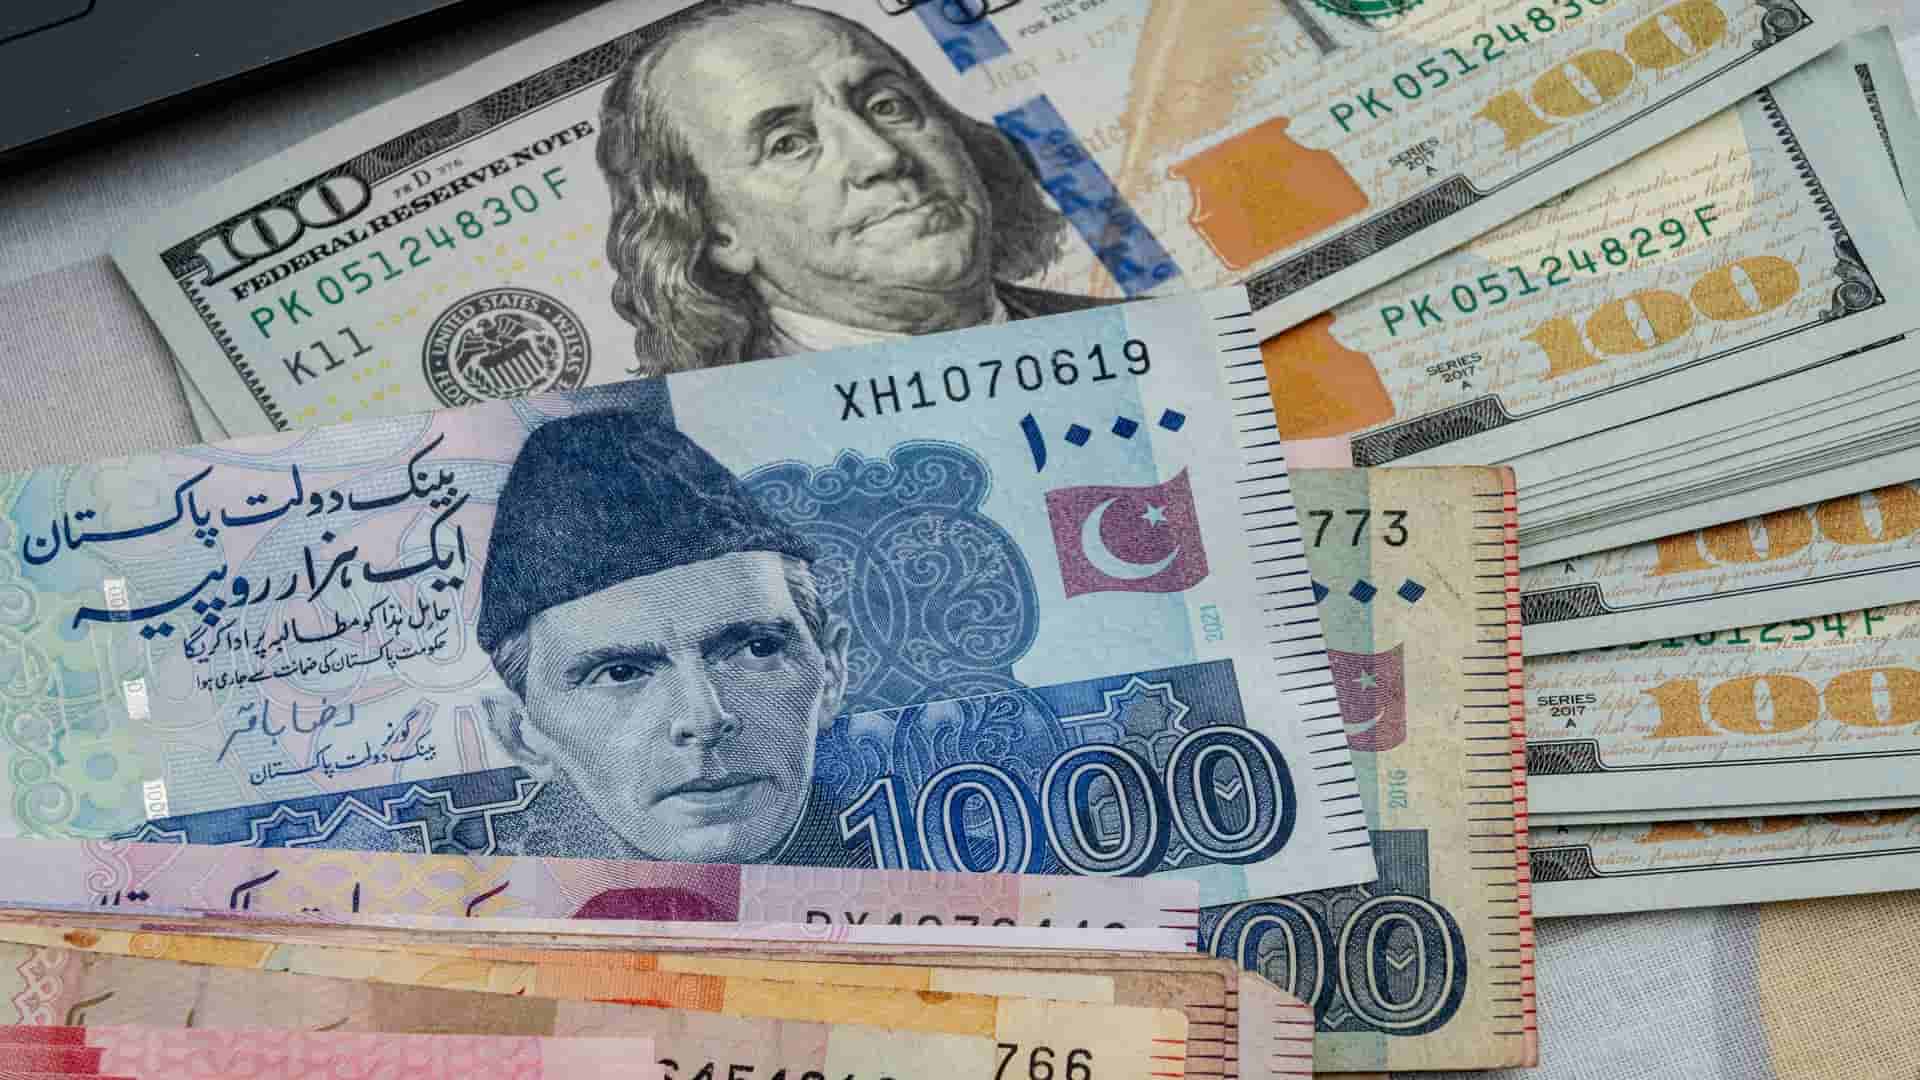
Discover the strongest currencies in the world, what makes a currency strong, and how currency strength affects forex trading and currency pairs.


