


Forex Market Analysis: The exchange rate between the British pound and the United Arab Emirates dirham in 2026 is shaped by a wide mix of macroeconomic forces, regional developments, and global financial conditions.
Commodity market today: The announcement that the UAE will exit the Organization of the Petroleum Exporting Countries (OPEC) starting May first marks a pivotal moment in the global oil industry.
Crypto market analysis: Recently, the cryptocurrency AAVE has experienced a notable surge against the South African Rand (ZAR), drawing attention to the evolving dynamics of the crypto market in South Africa.
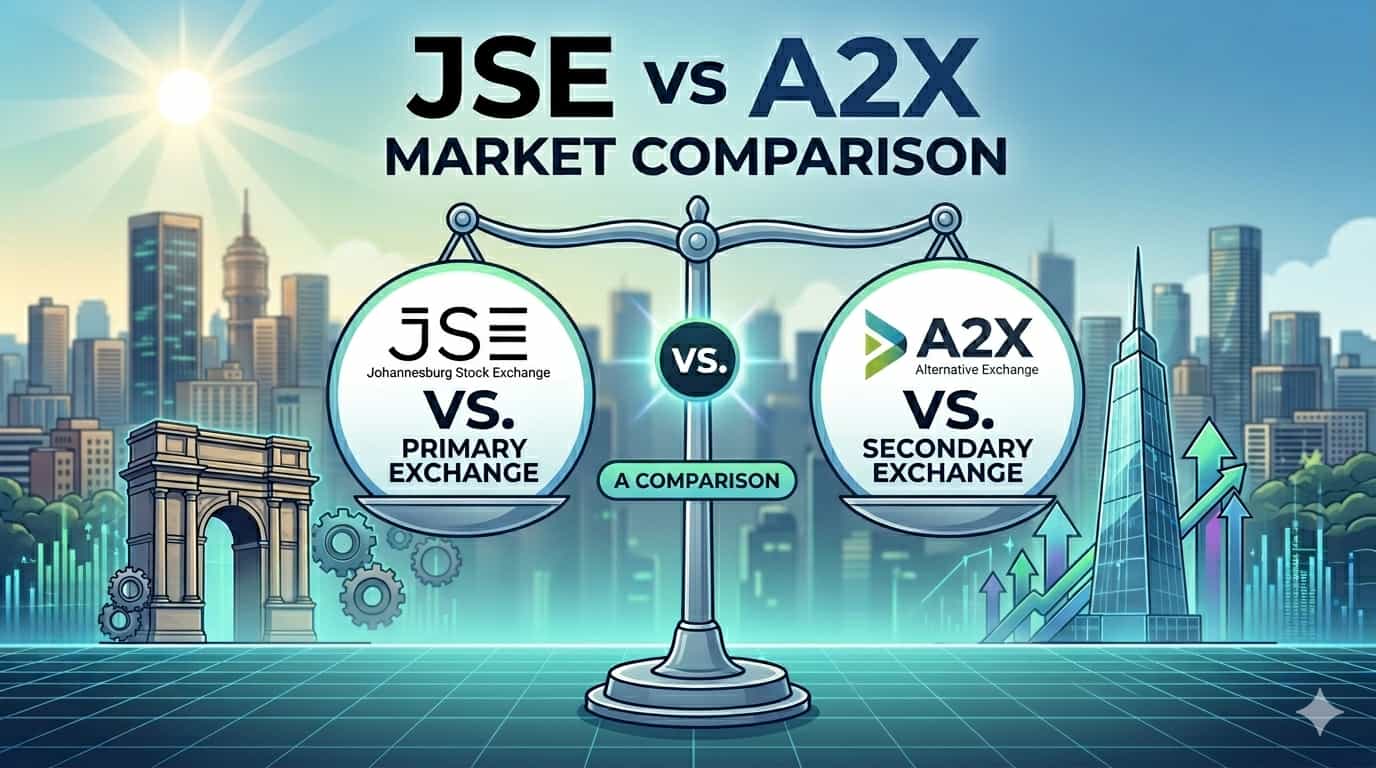
A Comparative Analysis of JSE and A2X for ZA Traders: For South African traders and investors, choosing where to execute equity trades has become more important than ever.
ETH Price Prediction 2026: Ethereum continues to hold its place as one of the most important assets in the cryptocurrency market, and recent trading activity has brought renewed attention to its outlook for 2026.

Mag 7 stocks analysis: The Magnificent Seven stocks continue to dominate conversations across global financial markets.
The oil market is exhibiting an unusual phenomenon, with prices remaining relatively stable despite complex geopolitical developments in the Middle East, particularly between the US and Iran. This analysis delves into the reasons behind this apparent stability, including reduced risk premiums, proactive fuel stocking, and cooling spot demand. A deeper look reveals that the fundamental supply-demand dynamics remain tight, with significant draws in global oil inventories, signaling substantial long-term upside risks.

How to trade CFDs in Australia: CFD trading has grown significantly in popularity among Australian investors due to its flexibility, leverage options, and ability to access a wide range of financial markets.

How to trade popular AI stocks from South Africa: In South Africa, many investors and short-term traders are turning their attention toward international technology shares such as AMD, Intel, and Microsoft.

Solana (SOL/USD) Price Prediction: Solana has become one of the most recognized blockchain networks in the cryptocurrency space, known for its ability to process transactions quickly while maintaining relatively low costs.
Bitcoin (BTC/USD) Trends in South Africa 2026: Bitcoin adoption in South Africa has moved beyond early experimentation and is now embedded in the country’s financial, technological, and social landscape.

Why Oil Keeps Rising: Oil prices are surging toward $122/barrel as the Strait of Hormuz remains effectively closed, choking 20% of global supply.
Crypto Market News Today: Dogecoin, the well-known meme-inspired cryptocurrency, has captured renewed attention in early 2026 by surging past the 0.115 level.

Gold Price Today: Gold prices surged sharply on Thursday, May 07, with the XAU/USD pair jumping 2.73% to hit a new all-time record high of $4,685.

Forex Market Today: The foreign exchange market witnessed a remarkable movement as the USD/JPY currency pair surged past the 150 level, signaling a renewed strength in the US dollar against the Japanese yen.

Learn how to trade S&P 500 in 2026, including CFDs, ETFs, market drivers, risks, and beginner trading steps.

Learn what bitcoin mining is, how it works, why miners matter, and how mining can influence Bitcoin price behaviour, volatility, and crypto CFD trading decisions.

Learn the key differences between scalping and day trading, including timeframes, strategies, risks, costs and which style may suit CFD traders.


