
Howard Marks, co-founder of Oaktree Capital, shares his insights on current market cycles, emphasizing asset pricing over market timing. He notes a shift from extreme optimism to a corrective phase, with valuations still elevated. Marks underscores that value investing and growth are not mutually exclusive, with the key being the right price. Selling decisions are framed as evaluating a "reverse buy" proposition. He highlights the importance of tailoring investment strategies to different asset classes and risk appetites.
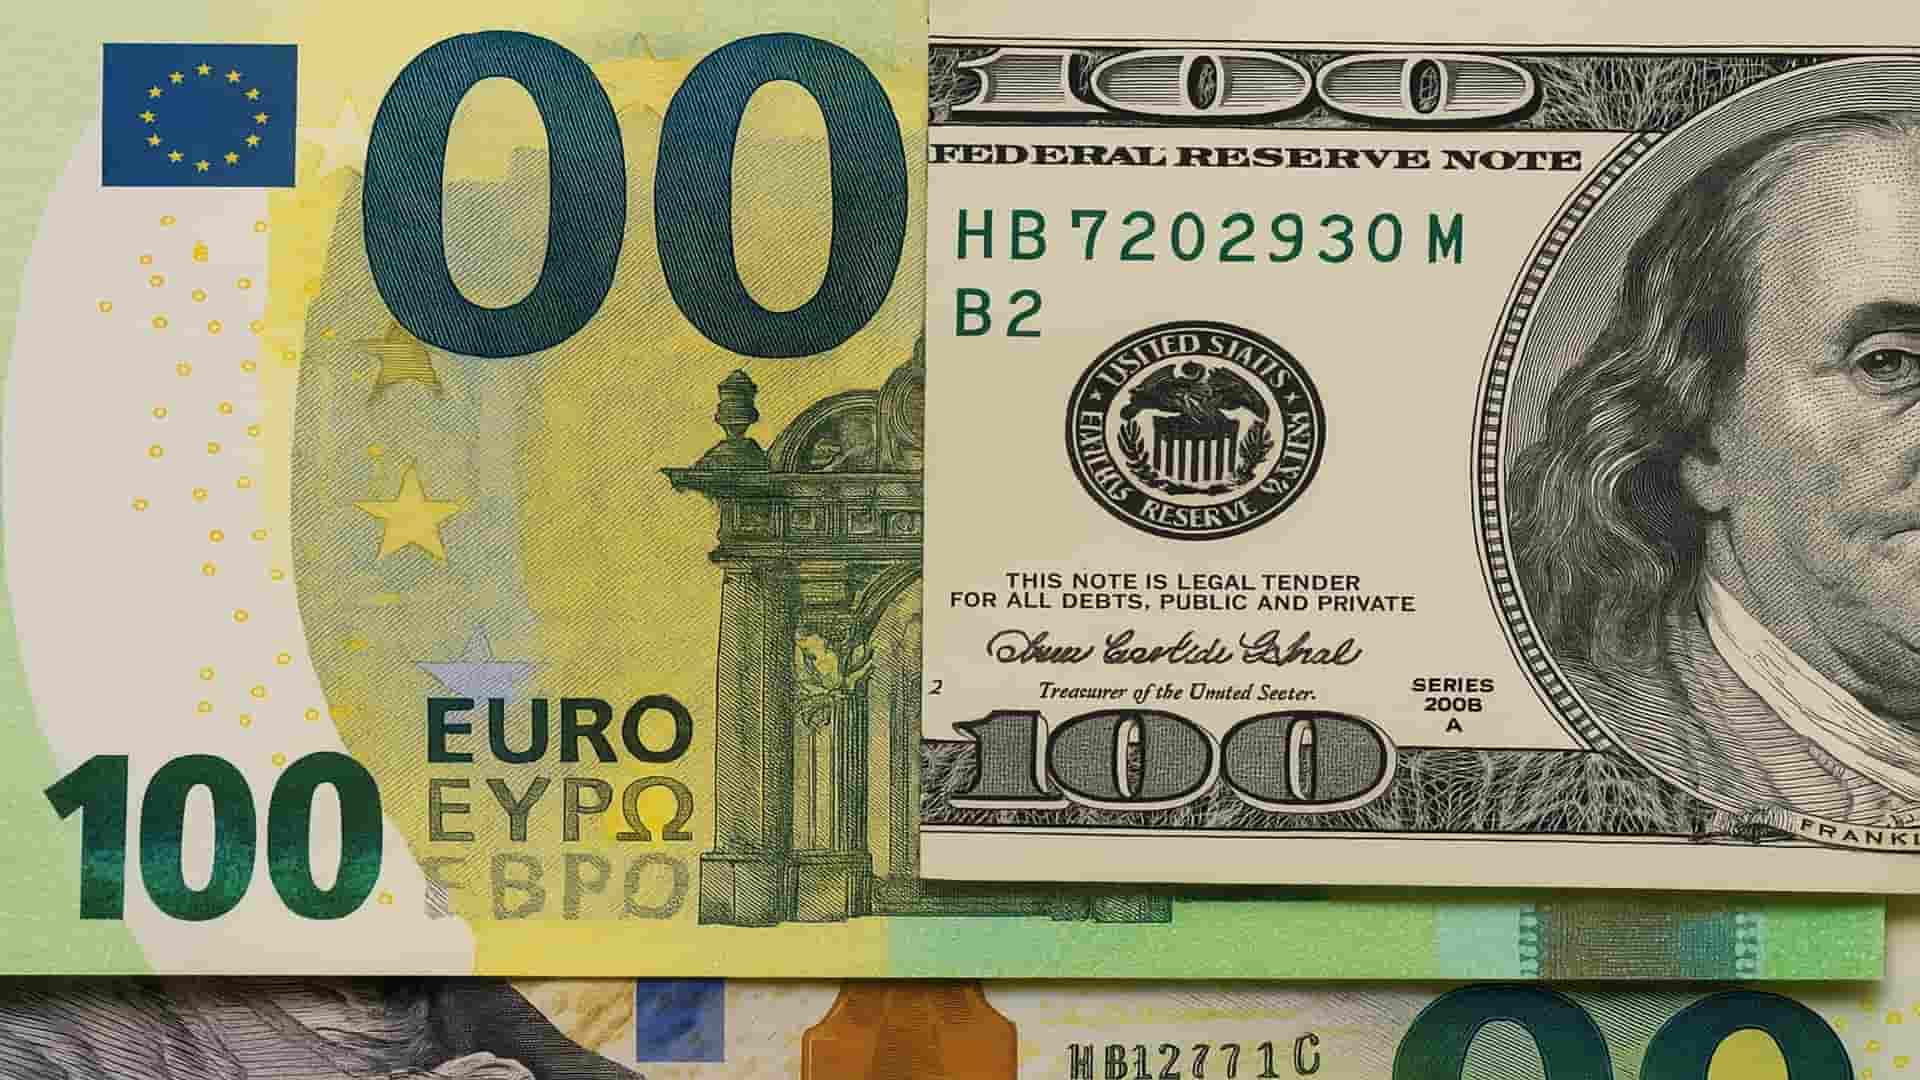
EUR/USD Forecast: The EUR/USD pair is approaching a critical technical zone, with bullish momentum pushing the euro toward a key resistance level.
HSBC notes that investors appear to be moving past the Iran conflict, with the S&P 500 fully recovering its losses. Chief Multi-Asset Strategist Max Kettner confirms this market reaction aligns with historical patterns during geopolitical upheaval, albeit with a more pronounced initial sell-off and longer duration. Despite recent escalations, markets remain relatively stable. Kettner presents an extremely bullish outlook on equities, citing improved financial conditions and falling oil prices, suggesting current market sentiment and positioning signal buying opportunities.
Apple stock analysis: Apple Inc., a global technology giant, has entered a new chapter with the recent appointment of John Ternus as CEO.
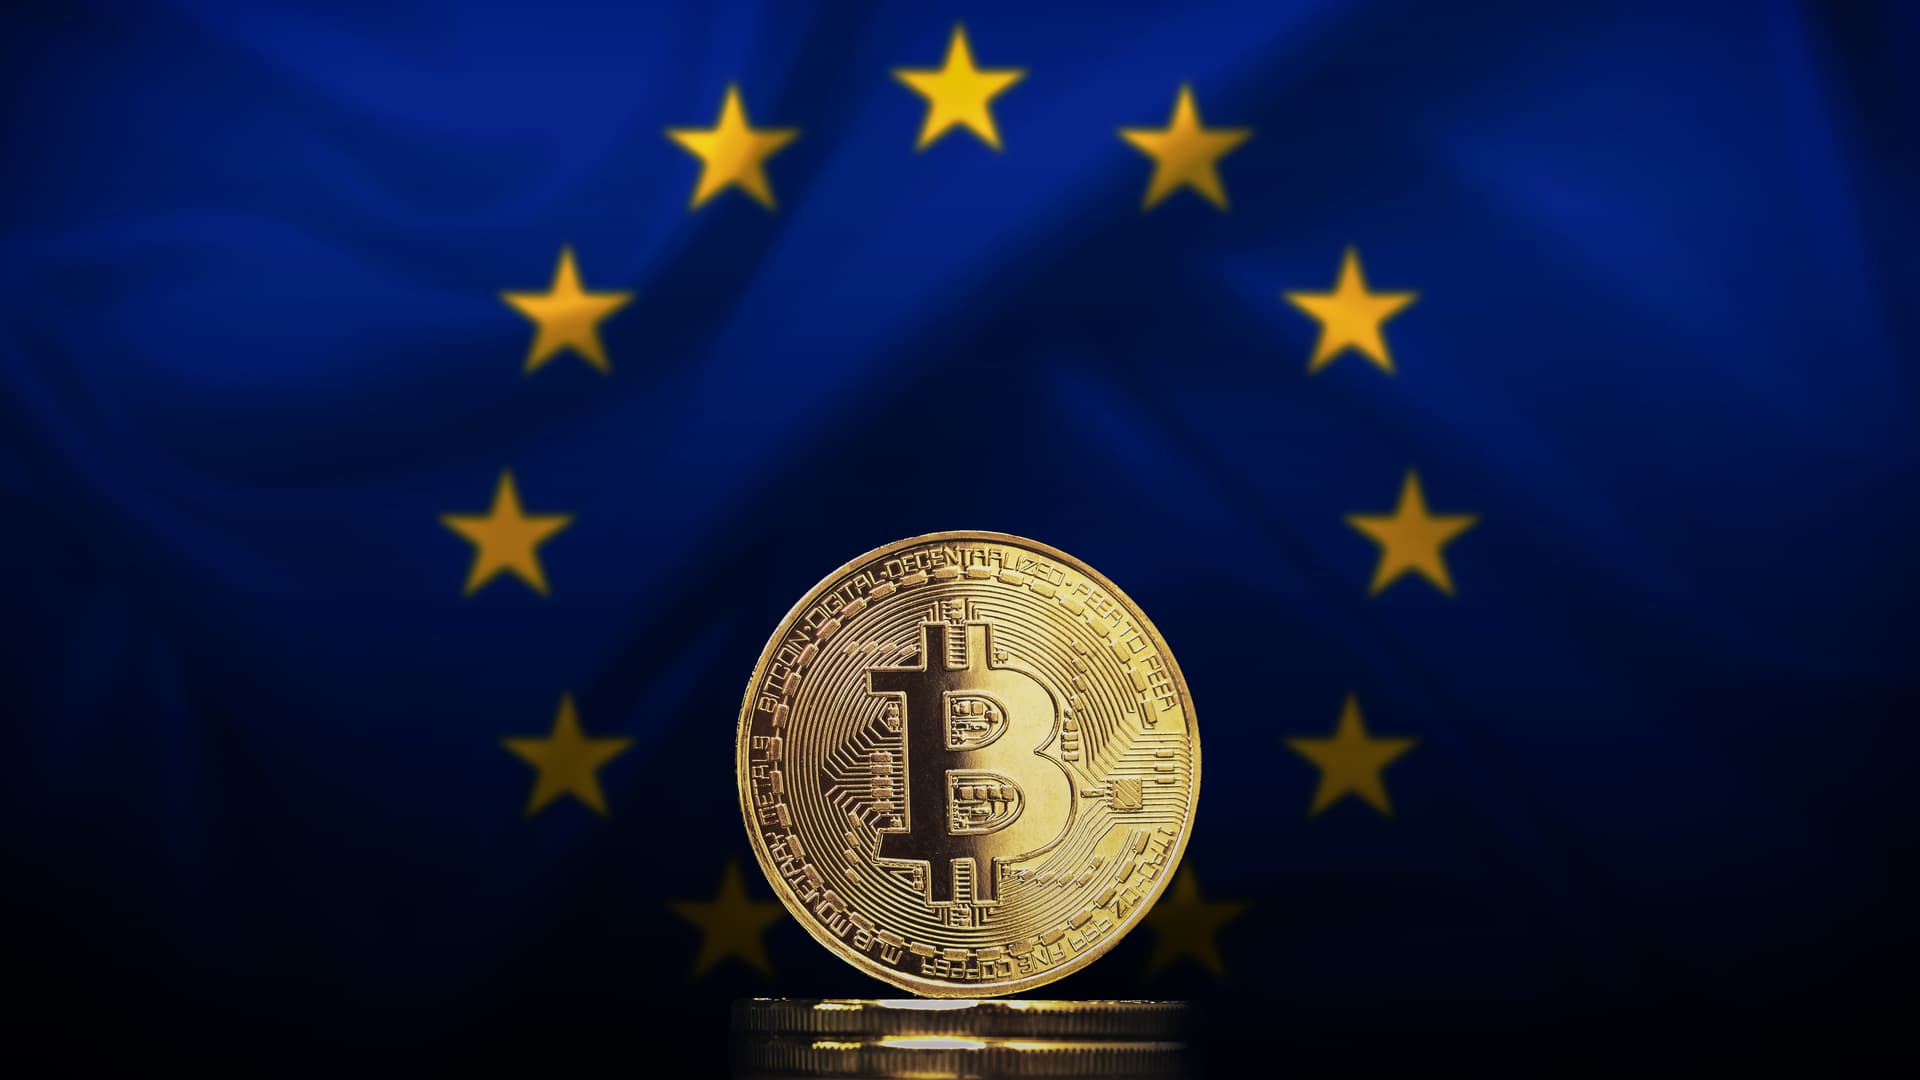
BTC/EUR Outlook April 2026: As April 2026 unfolds, Bitcoin’s relationship with the euro has entered a critical phase, the BTC/EUR pair is no longer just a speculative instrument driven by retail enthusiasm.
In an unprecedented move, Kuwait has invoked force majeure concerning the delivery of crude oil and refined products, citing the blockade of the Strait of Hormuz as the primary reason. This declaration directly affects supply commitments to customers who cannot have their vessels reach their destinations within the Persian Gulf. Kuwait Petroleum Corporation's decision is based on the force majeure clause within contracts, which allows for suspension or delay of deliveries under exceptional circumstances. This comes amid escalating regional tensions that have severely disrupted maritime traffic in the Strait of Hormuz, a critical global energy transit route. The disruption has led to rapid saturation of oil storage facilities in the region, casting a shadow over the global oil market. For Gulf nations heavily reliant on energy export revenues to support their budgets, the effective closure of this vital waterway presents a significant challenge.
This article provides a comprehensive analysis of the intricate challenges surrounding the potential transfer of high-enriched uranium (HEU) from Iran. It discusses initial reports of Iran's possible agreement to transfer the material, highlighting the conflicting official statements. The article reviews the US's past experiences with similar operations, such as "Operation Sapphire," but emphasizes the significant gap between those experiences and the current situation in Iran. Damage to nuclear facilities, lack of direct access, and a tense diplomatic environment complicate the mission immensely. Furthermore, the article delves into the technical aspects of the transfer process, including assessing the condition of uranium containers, the potential need to convert it to a safer form, and the operational complexities of handling hazardous materials. It also explores the political and diplomatic challenges of determining the uranium's final destination, the potential roles of Russia, the IAEA, and the US, as well as ongoing concerns about potential Iranian concealment of materials. The article concludes by stressing the necessity of stringent verification mechanisms to ensure transparency and credibility.
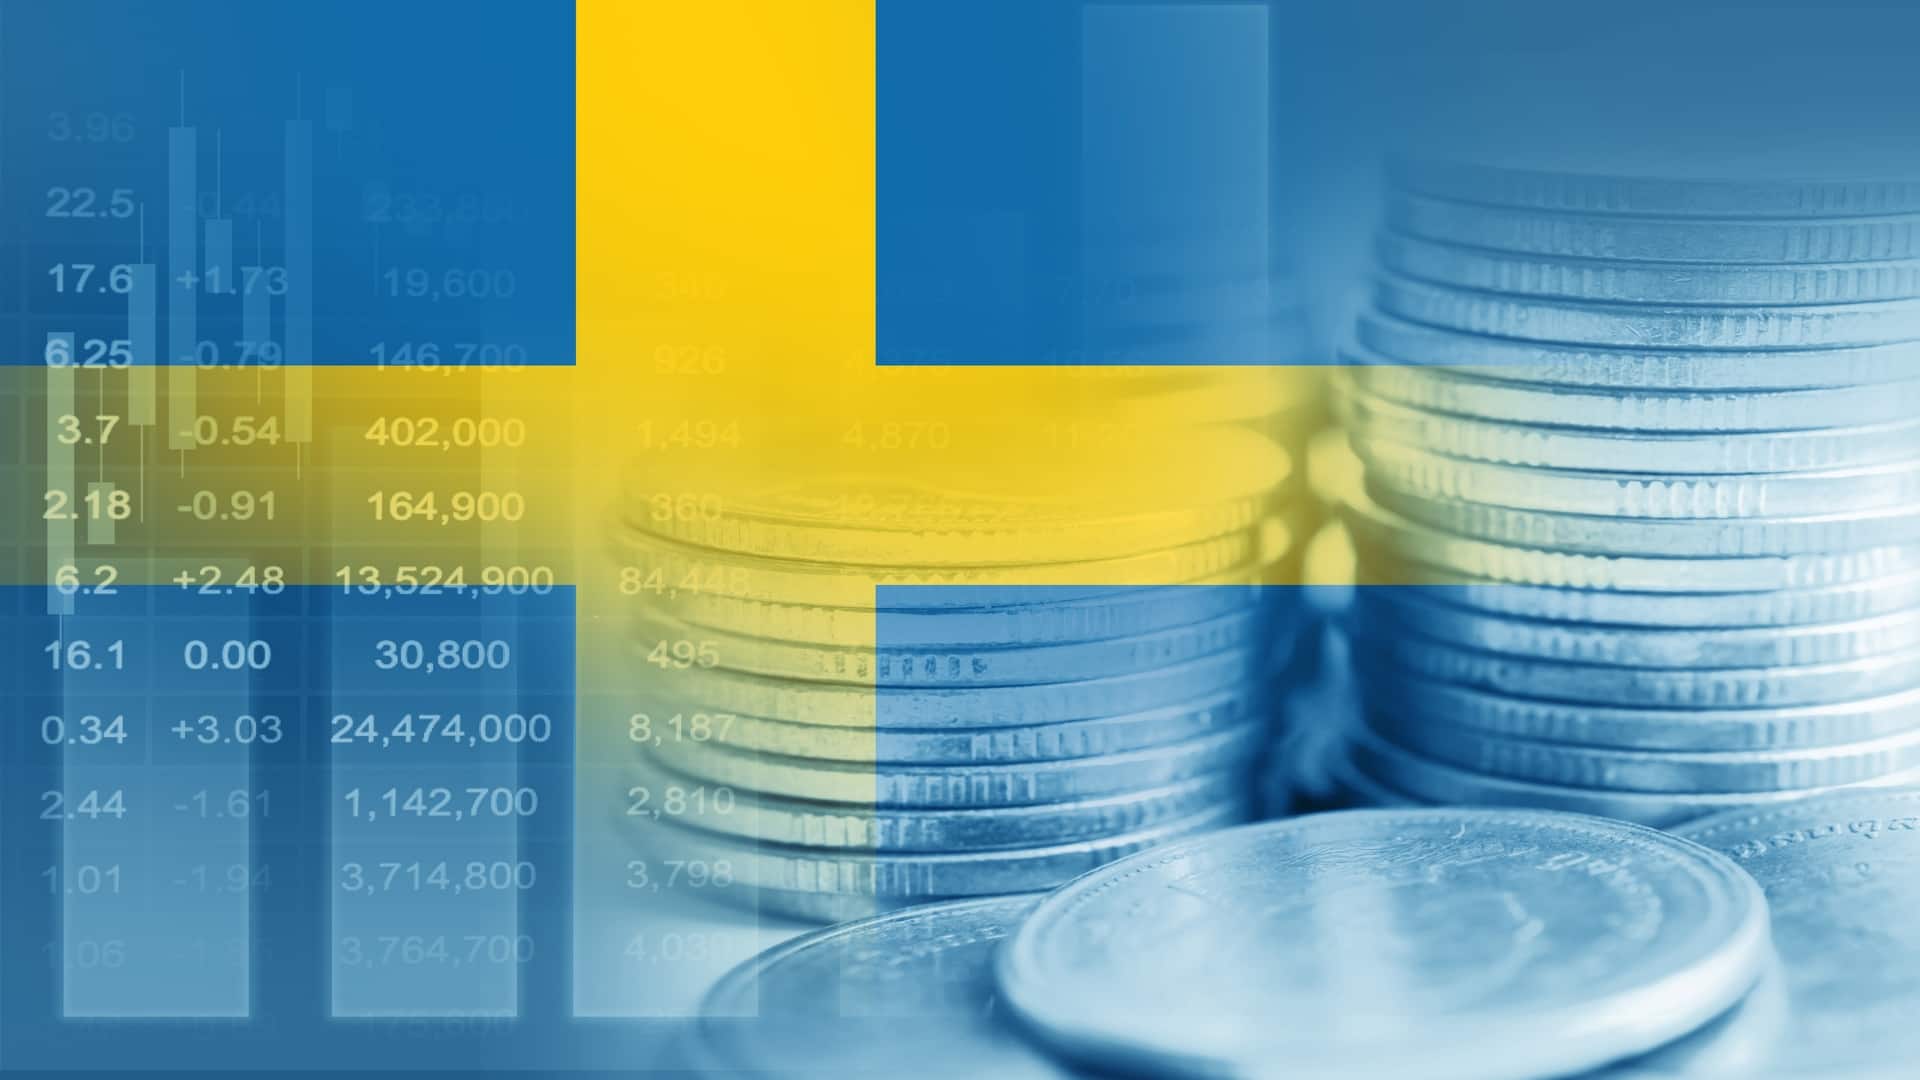
O4X.F stock is trending: Karnell Group AB (publ) has recently emerged as a trending small-cap industrial stock, drawing attention from both short-term traders and long-term investors.
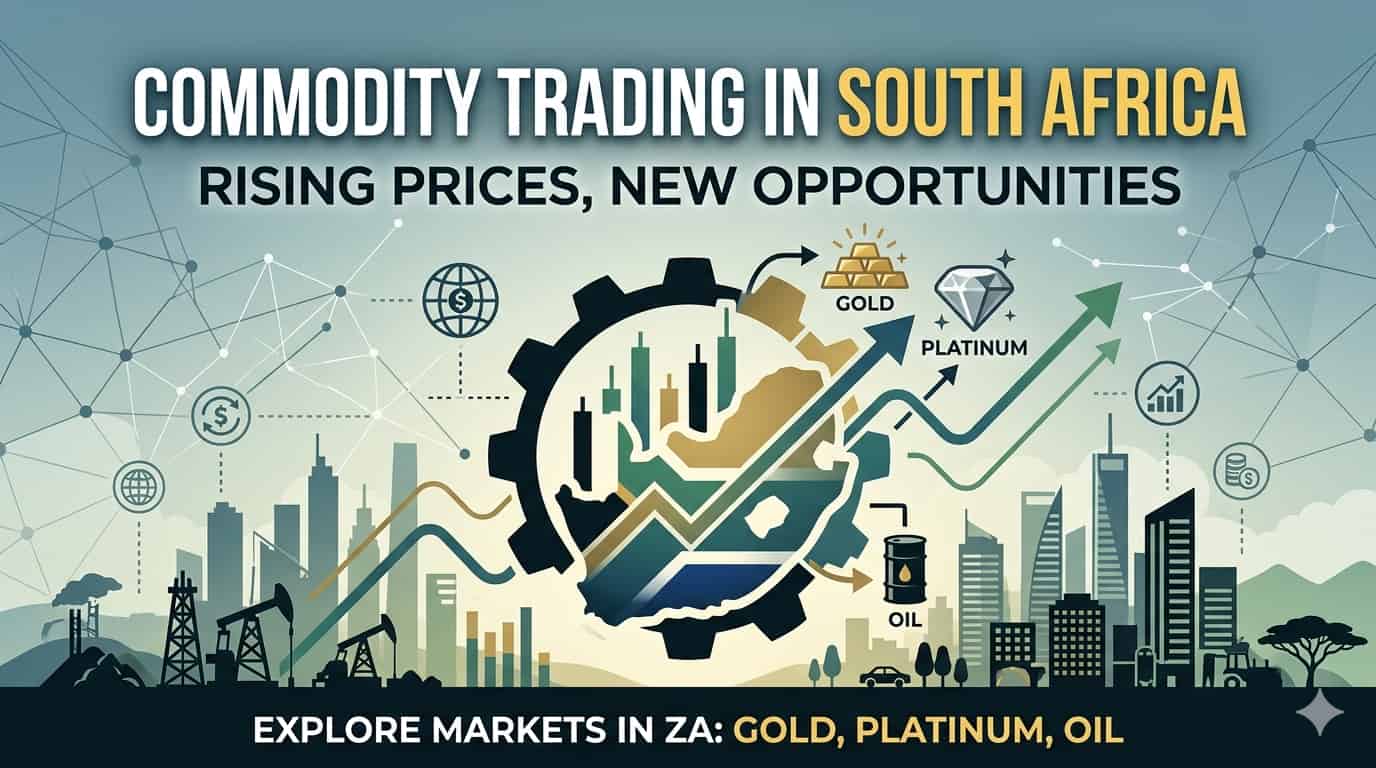
Commodity Trading in South Africa: South Africa holds a central position in global commodity markets, particularly through its deep reserves of precious metals and its role in energy consumption across the African continent.

Latest 22K Gold Price per Gram in Dubai: As of the latest market conditions in 2026, the price of 22K gold in Dubai is generally ranging between 528 and 539 UAE dirhams per gram.

Lowest Cost CFD Brokers in Dubai (2026): Dubai has become one of the most active CFD trading hubs in the Middle East.
Top 5 Bitcoin Brokers in South Africa for 2026: The cryptocurrency market in South Africa continues to expand rapidly, fueled by growing interest in Bitcoin and other digital assets.
Reports indicate President Trump has granted Iran an extended ceasefire period, with signs pointing to a potential second round of talks. However, a deeper look reveals profound fissures within Iran's command structure, particularly between the military wing led by the IRGC and civilian elites, complicating any agreement. This coincides with a postponed trip for the US Vice President to Islamabad, underscoring the challenges in achieving diplomatic breakthroughs amid Iran's internal schisms.
This article details warnings issued by Ukrainian authorities regarding Russian military activities around nuclear facilities, focusing on the heightened risks posed by drone and missile flights near Chernobyl and another power plant. It highlights statements from Ukraine's Prosecutor General, reassurances from the International Atomic Energy Agency, potential missile malfunctions, and the ongoing threat to radioactive containment structures by drones.
When Tesla releases its quarterly earnings report, the specific financial figures may once again take a backseat to the grand narrative detailing the company's explorations into future domains such as autonomous taxi services and humanoid robots. Analysts suggest that the gap between vision and execution could be widening, potentially exacerbating market concerns about its financial standing. While Wall Street anticipates improved earnings per share and revenue growth, preliminary data on electric vehicle deliveries and energy deployments fell short of expectations. Investor attention has increasingly shifted towards Tesla's self-driving taxi ambitions, where the pace of expansion is facing scrutiny. Questions also linger regarding the timeline for the 'Optimus' humanoid robot. Furthermore, significant capital expenditures, particularly for the 'Terafab' chip manufacturing project, are expected to increase, raising questions about their financial implications for the company.

Why is gold valuable? Discover how scarcity, monetary history, safe-haven demand, and central-bank buying continue to support gold’s role in modern markets.
Learn how leveraged ETFs work, the risks traders should know, and how they compare with ETF CFD trading for short-term market exposure.
Trading vs investing: which is more profitable? Learn the key differences, risks, time horizons, and which approach may suit your goals, style, and strategy best.


