

The configuration is positive.
What are the best SPY ETFs: Instead of researching and purchasing individual companies one by one, ETFs allow market participants to gain exposure to entire sectors, industries, or indexes through a single investment vehicle.

Top 10 forex brokers in South Africa for beginners: South Africa has become one of the most active forex trading markets in Africa, with thousands of new traders entering the market every year.

Dow Jones Index today analysis: The Dow Jones Industrial Average remains one of the most influential stock market indices in the world.

Palantir Stock Price Prediction 2030: Palantir Technologies has become one of the most talked-about artificial intelligence firms in global markets.

Why South African Investors Love QQQ ETF: In recent years, South African investors have become increasingly interested in international investing.

Gold Price Today: Gold prices moved lower on May 20 as XAU/USD dropped below the important 4,500 level, reflecting growing pressure from stronger bond yields, a firmer U.S. dollar, and cautious investor sentiment.

Shares of Huntington Bancshares moved higher after the company completed its expansion strategy tied to the Cadence acquisition, giving the regional bank a much larger presence across Texas and the southern United States.

DJT Stock Today: DJT shares moved lower after Trump Media & Technology Group posted a massive first-quarter loss, raising new concerns about the company’s financial direction and long-term business strategy.

Learn what a trading journal is, why it matters, what to include, and how CFD traders can use one to improve discipline, risk management, and performance.

Master the Morning Star candlestick pattern. Learn to spot bullish reversals, manage risk, and improve your strategy with our expert guide.
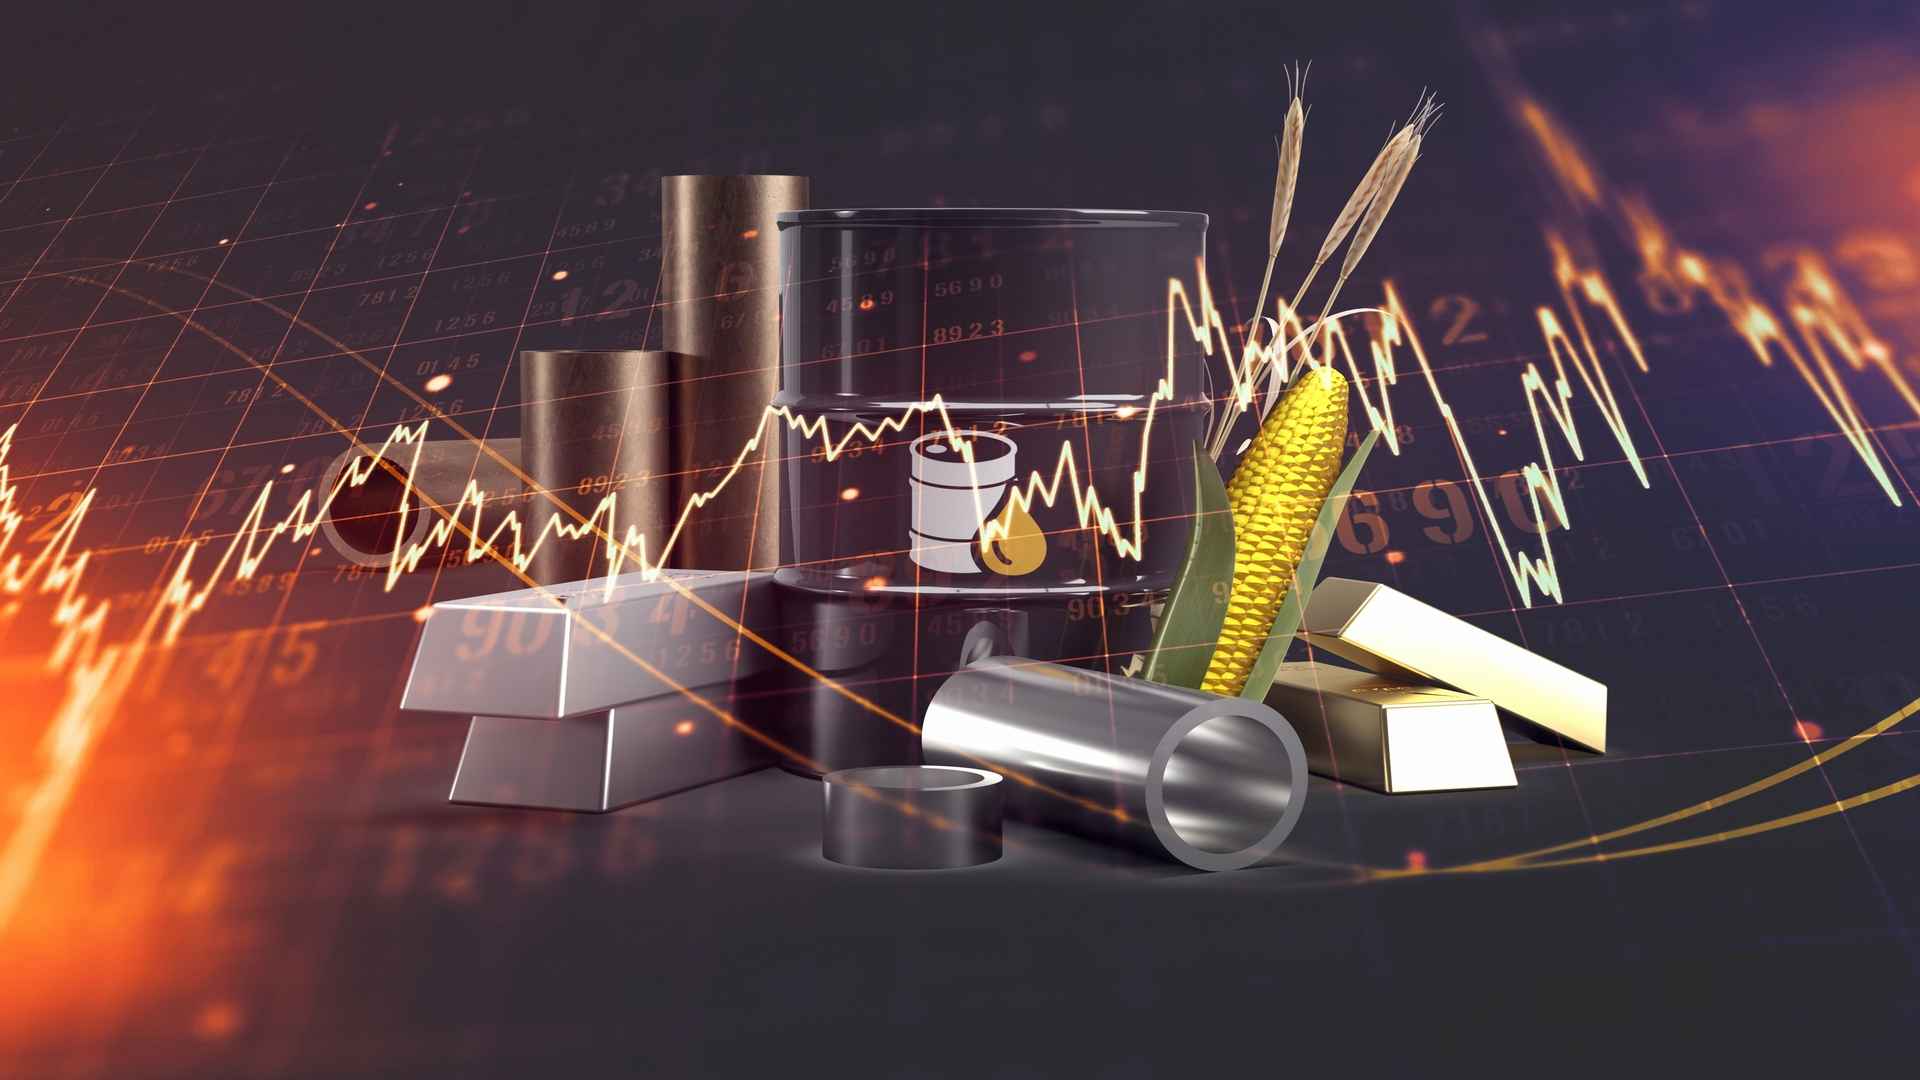
Understand the vital differences between hard and soft commodities. Learn about price drivers, market volatility, and how to trade them via CFDs.


