

Gold's safe-haven status is being questioned amidst escalating geopolitical tensions, leading to a price decline. This analysis delves into the underlying factors driving this movement, including liquidity needs, interest rate impacts, ETF flows, central bank buying, and offers a price outlook based on these dynamics.
This article examines the potential consequences of US President Donald Trump's decision to end the war with Iran without reaching an agreement. It suggests that such an action could solidify Tehran's control over Middle East energy supplies, leaving Gulf nations to bear the brunt of a conflict they did not instigate. The analysis explores how this could empower the Iranian regime, increase regional threats, and destabilize global energy markets, with a focus on the critical role of the Strait of Hormuz.
European market insights: As of April 3, 2026, the European stock market is navigating a complex recovery phase, characterized by a sharp bullish reversal following a volatile first quarter.
EUR/USD Analysis Today: The EUR/USD currency pair is experiencing notable movement today, gaining traction and reaching 1.1550 amidst ongoing geopolitical uncertainty in the Middle East.
Microsoft is experiencing its worst quarterly performance on Wall Street since the 2008 financial crisis, largely due to investor disappointment regarding its AI prospects. Despite its dominance in productivity software and Windows, the company faces dual pressures to achieve efficient AI growth and build supportive cloud infrastructure. This comes as AI triggers a 'SaaS-pocalypse' for software stocks. This analysis delves into the challenges surrounding Copilot, managerial adjustments, the resilience of Azure, and intensifying AI competition, featuring an optimistic outlook from CEO Satya Nadella.
This article examines how Iran, despite significant losses, has managed to leverage its control over the Strait of Hormuz for strategic gains. Iran's proposal to levy transit fees on ships threatens to disrupt the global economy and create a new revenue stream for the regime. The analysis explores the challenges facing the US in confronting this threat, the limitations of military solutions, the possibility of high-stakes negotiations, and the broader implications for regional countries and Asian and European markets.
After a significant sell-off, the gold market is showing signs of recovery, holding onto its annual gains and extending its multi-year, record-breaking bull run. This article examines the causes of the recent downturn, the roles of central banks and ETFs, the structural drivers supporting gold, and the future outlook in the face of geopolitical and economic challenges.
Best South Africa Investment ETFs in 2026: As the investment landscape evolves, exchange-traded funds (ETFs) remain popular for both local and international investors looking to gain exposure to South Africa's diverse economy.

Crude oil prices rise to $112 per barrel: The global energy landscape in early 2026 has been defined by a volatility not seen in years.

Commodity market outlook: In recent trading sessions, West Texas Intermediate (WTI) crude oil has seen a remarkable increase of 4.5% to 6.3%.
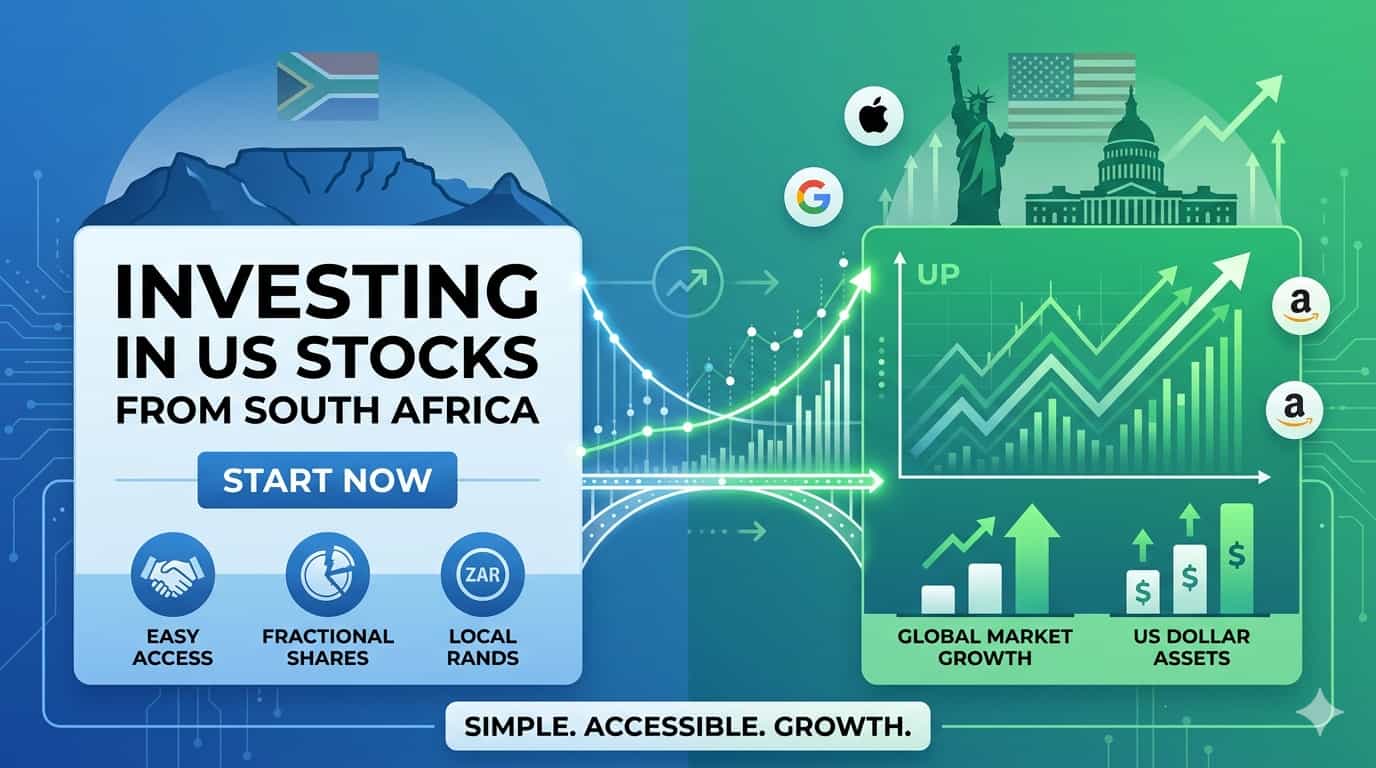
Investing in US Stocks from South Africa: Investing in US stocks has become increasingly appealing for South African investors seeking diversification, growth opportunities, and access to some of the world's most successful companies.
How to Invest in Stocks for Beginners (Europe): Investing in stocks can be a rewarding venture for beginners in Europe.
Recent reports indicate the Trump administration is preparing to overhaul its steel and aluminum tariff regime, intending to streamline regulatory compliance for manufactured goods. However, analyses suggest these changes may lead to a substantial increase in the cost of many goods entering the U.S. market, raising questions about the economic and operational impact on businesses and consumers. This article delves into the proposed details of these adjustments, their potential effects across various sectors, the regulatory context leading to these shifts, and industry reactions.
Sources have revealed that SpaceX, the rocket company led by billionaire Elon Musk, has secretly filed for an Initial Public Offering (IPO) with the U.S. Securities and Exchange Commission (SEC). Initial reports suggest the company could be targeting a valuation of up to $1.75 trillion, with a potential listing anticipated around June. This move could position Musk as the first person to simultaneously helm two trillion-dollar companies, leveraging his significant stake in Tesla. The potential IPO is poised to be the largest in U.S. history, with speculation that SpaceX aims to raise as much as $75 billion. These developments follow strategic partnerships with U.S. government agencies and increasing successes in rocket launches and its Starlink satellite internet service. However, experts caution that the IPO's success hinges significantly on market stability and the geopolitical landscape, especially amidst current global tensions.
Recent US intelligence assessments suggest the Iranian government is disinclined to enter into substantive negotiations to end the ongoing conflict with the United States and Israel. Tehran reportedly perceives itself in a strong position, thus unwilling to concede to American diplomatic demands, despite maintaining open communication channels. This assessment aligns with contradictory statements from both sides and highlights challenges to diplomatic efforts due to mistrust and escalating military actions.
What Is Sensex in Stock Market: The stock market serves as a vital gauge of an economy's health, and various indices help investors navigate the complex landscape.
Investing basics for beginners: Understanding economic indicators is crucial for anyone interested in navigating the landscape of finance and investments.
Learn the key differences between CFDs and options, including pricing, risk, expiry, and trading uses, to understand which instrument may suit your strategy.


