

Crypto market analysis: Recently, the cryptocurrency AAVE has experienced a notable surge against the South African Rand (ZAR), drawing attention to the evolving dynamics of the crypto market in South Africa.
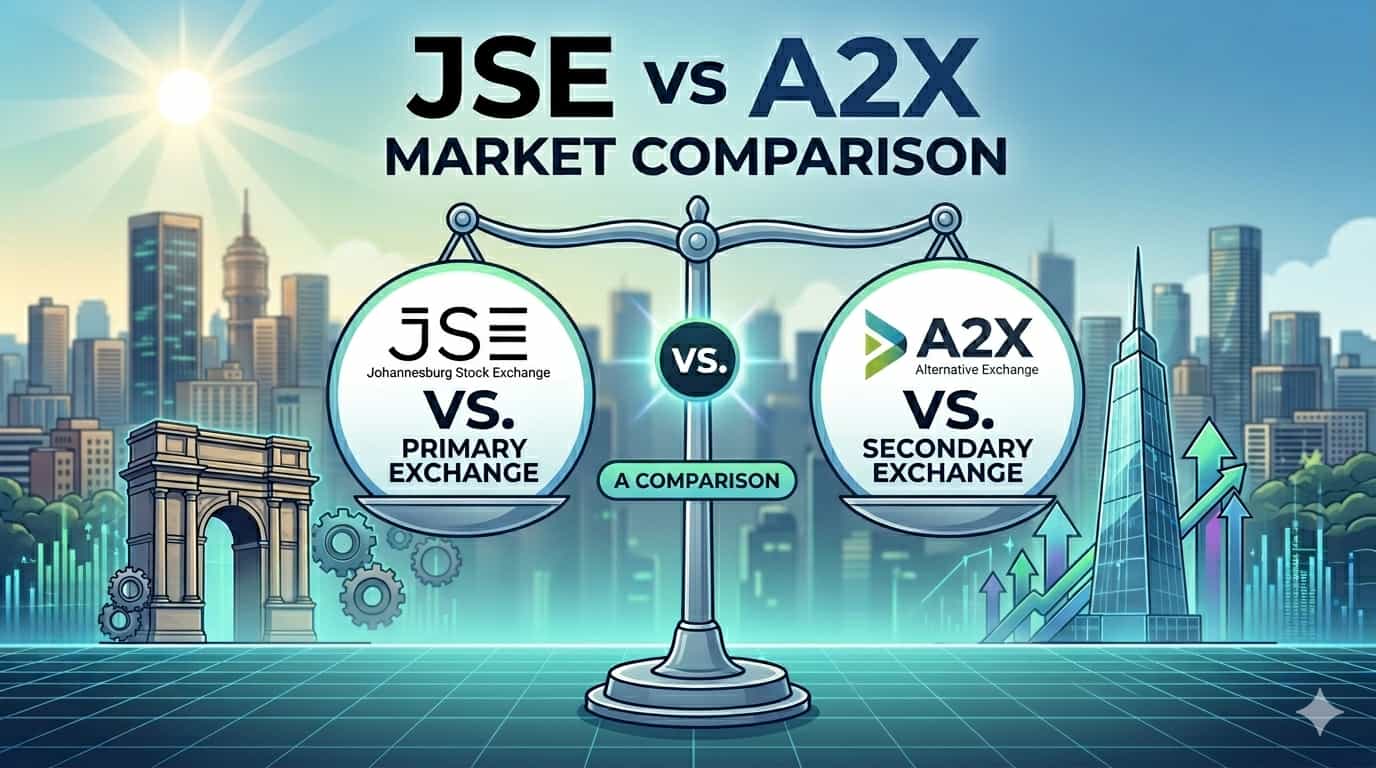
A Comparative Analysis of JSE and A2X for ZA Traders: For South African traders and investors, choosing where to execute equity trades has become more important than ever.
ETH Price Prediction 2026: Ethereum continues to hold its place as one of the most important assets in the cryptocurrency market, and recent trading activity has brought renewed attention to its outlook for 2026.

Mag 7 stocks analysis: The Magnificent Seven stocks continue to dominate conversations across global financial markets.
The oil market is exhibiting an unusual phenomenon, with prices remaining relatively stable despite complex geopolitical developments in the Middle East, particularly between the US and Iran. This analysis delves into the reasons behind this apparent stability, including reduced risk premiums, proactive fuel stocking, and cooling spot demand. A deeper look reveals that the fundamental supply-demand dynamics remain tight, with significant draws in global oil inventories, signaling substantial long-term upside risks.
This analysis explores the potential impacts of the US midterm elections on the energy sector. Analysts anticipate divergent outcomes for various energy segments depending on the winning party, with the overall energy sector appearing broadly favorable. Specific implications for renewables (solar and wind), nuclear power, and fossil fuels are detailed, considering anticipated regulatory and legislative shifts.
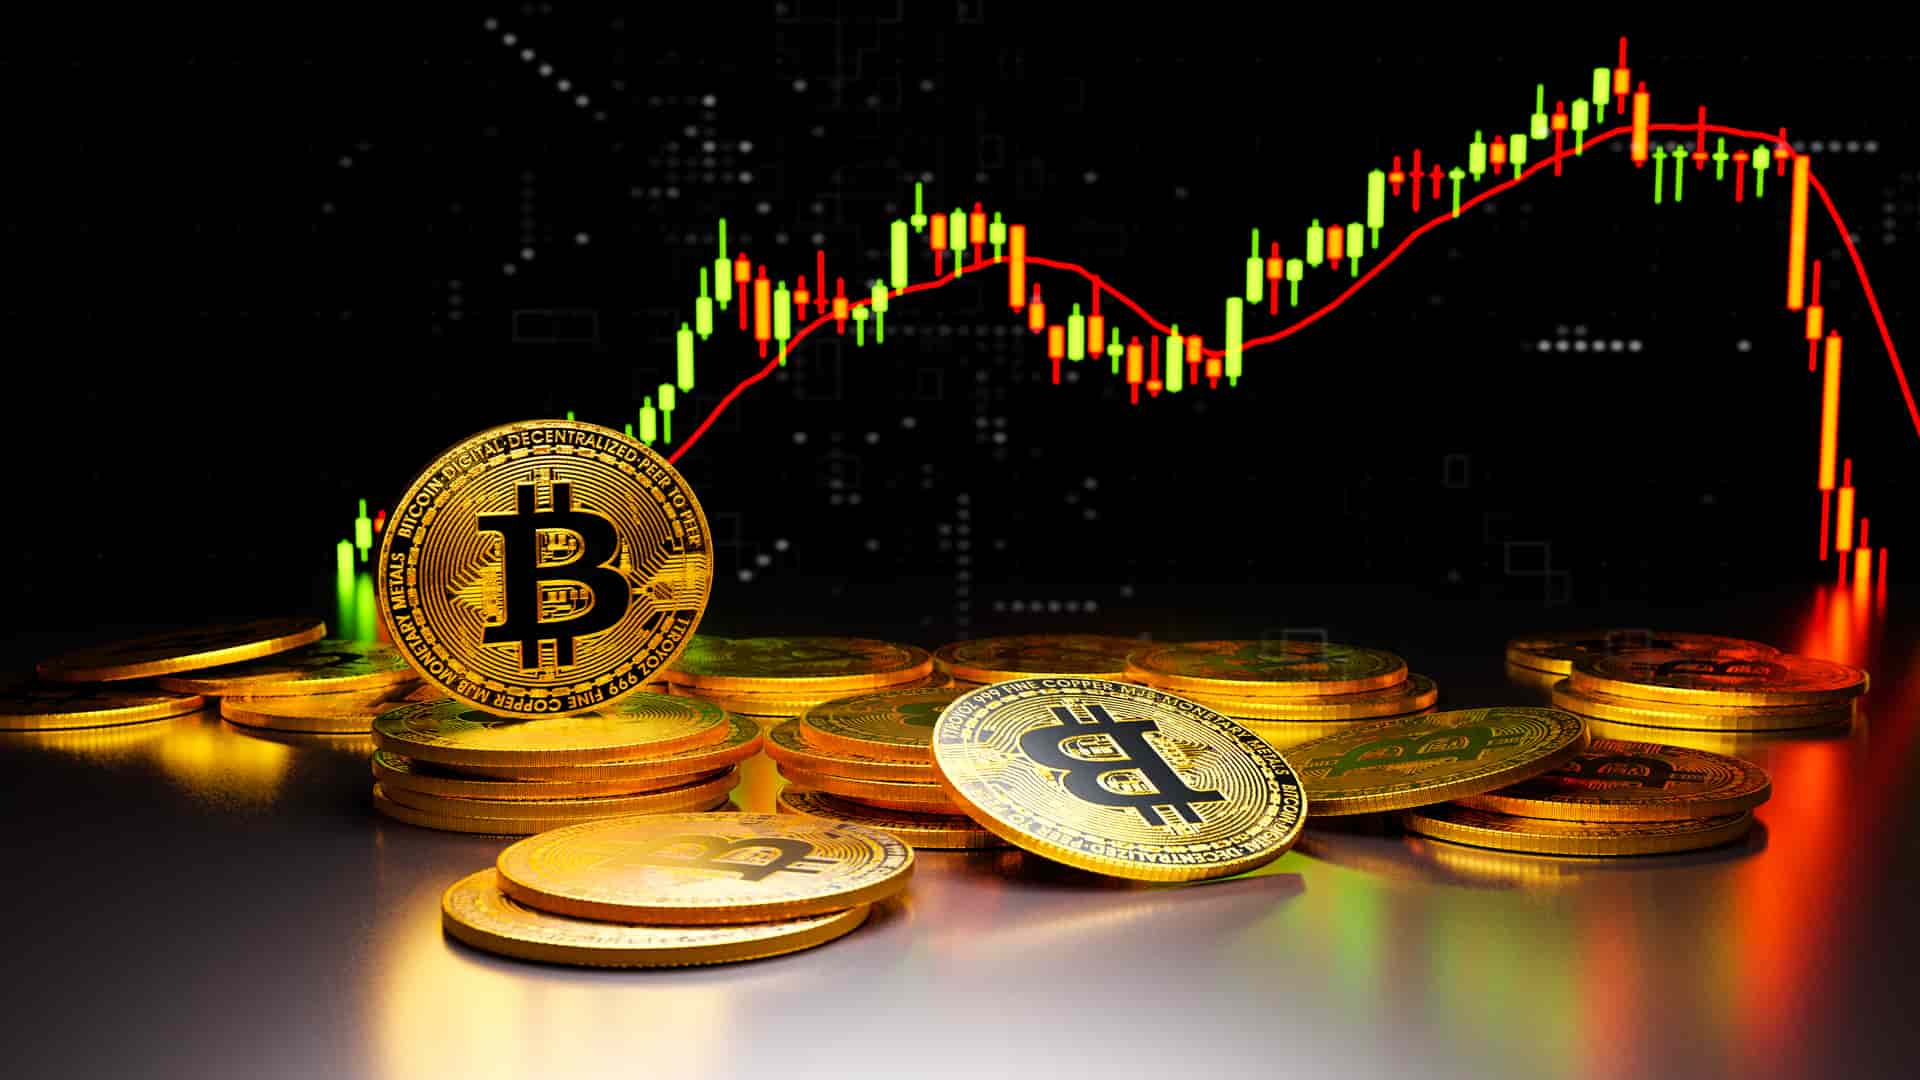
Bitcoin price analysis: Bitcoin, the pioneering cryptocurrency, has attracted enormous attention since its inception over a decade ago.

Why Oil Keeps Rising: Oil prices are surging toward $122/barrel as the Strait of Hormuz remains effectively closed, choking 20% of global supply.
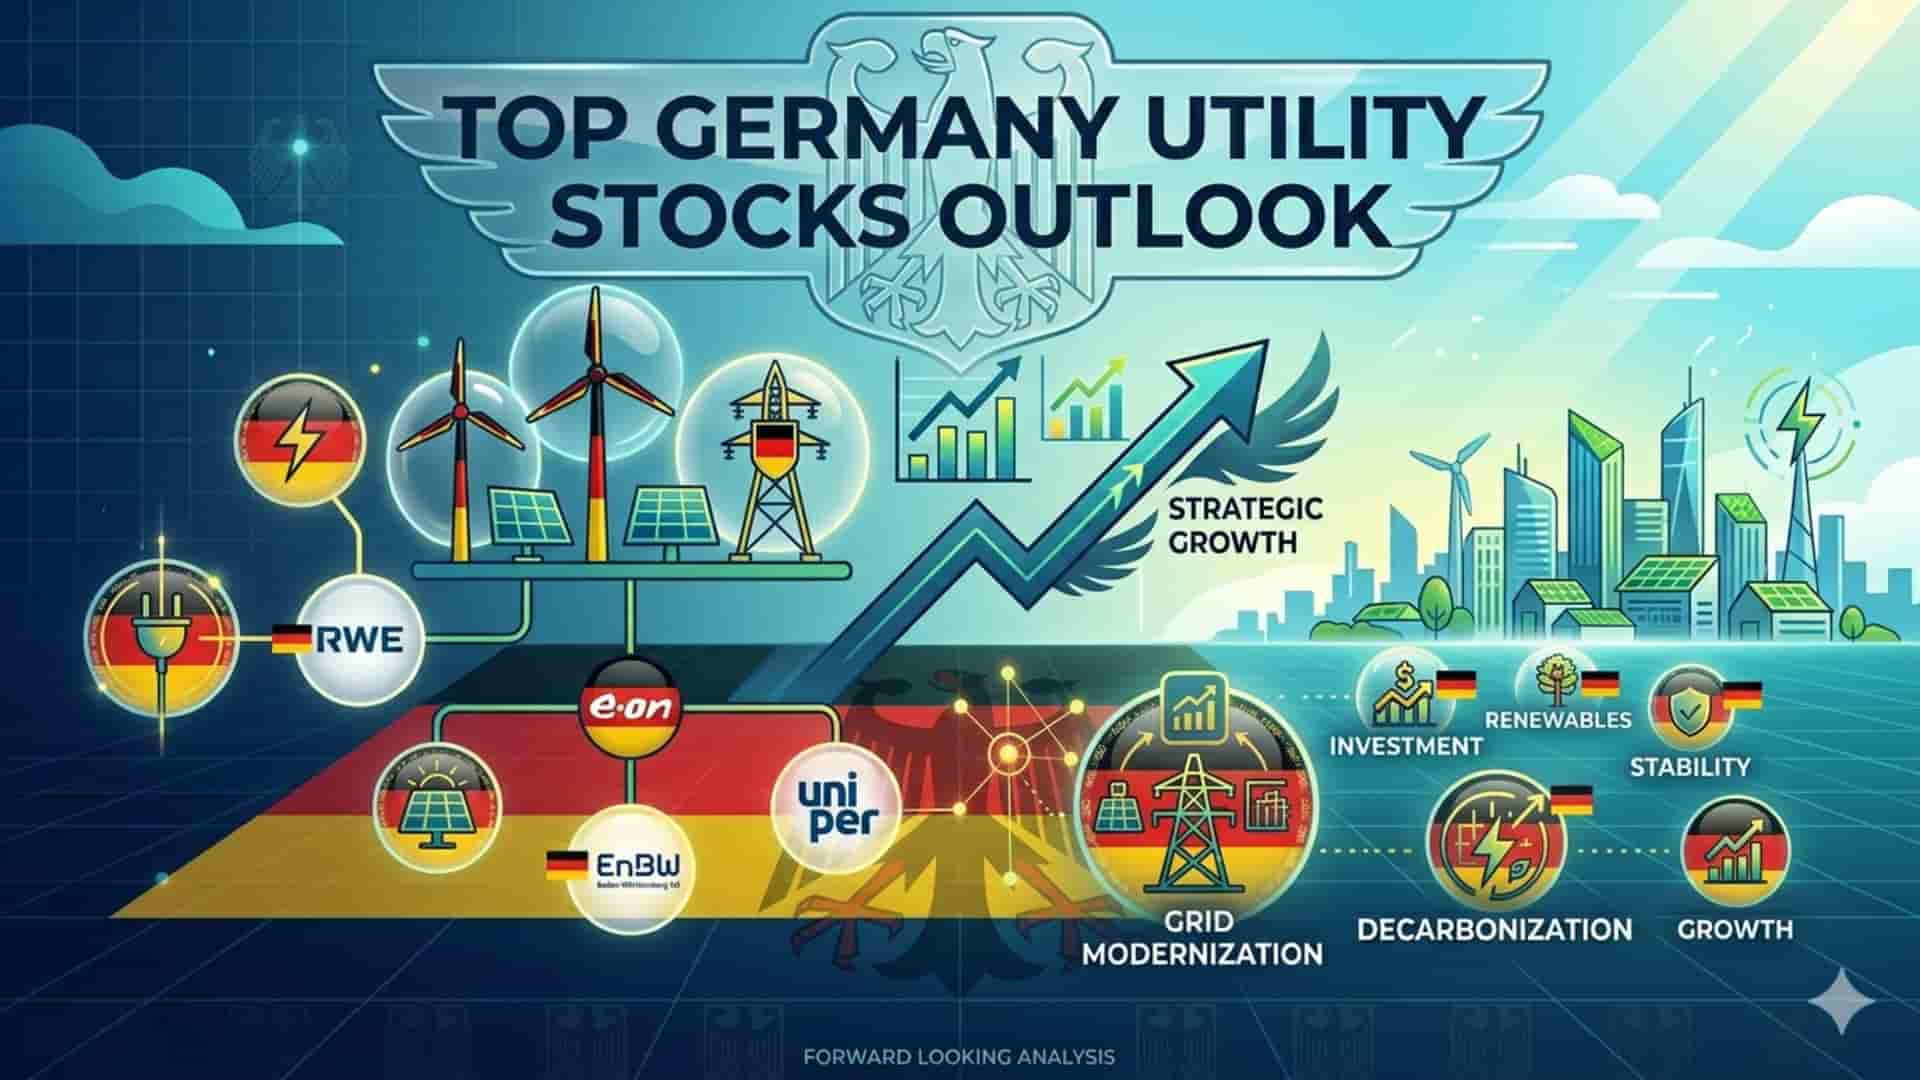
Top Germany Utility Stocks Outlook: The German utility sector remains a pivotal component of the European energy landscape, driven by transitions toward renewable energy, regulatory shifts, and evolving market demands.
Tech Giant Stock Analysis: Microsoft enters 2026 as one of the most influential companies shaping the global artificial intelligence economy.

Hang Seng Index drops below 26,000 points: The recent move of the Hang Seng Index below a widely watched threshold has attracted significant attention among market participants.
How to Start Buying Bitcoin in South Africa in 2026: Bitcoin remains one of the most talked-about digital assets in 2026, and South Africans are increasingly looking for practical ways to gain exposure to it.

Commodity Market Today: In a landmark announcement, the United Arab Emirates (UAE) has confirmed it will exit the Organization of the Petroleum Exporting Countries (OPEC) after nearly six decades of membership.

Gold Price Today: Gold prices surged on Thursday as the safe-haven metal reached a fresh high of $4,575 per ounce, driven by mounting fears over global economic instability and geopolitical tensions.

Apple (AAPL) Q2 FY26 is coming: Apple is preparing to release fiscal second-quarter FY26 earnings, and while the spotlight will naturally be on iPhone sales, Services growth, and margins.

Learn what mirror trading means, how it works, how it differs from copy trading, and what CFD traders should know before using it.

Learn what short selling means, how it works in CFD trading, key examples, risks and how traders manage short positions.

Learn the difference between leverage and margin trading, with simple examples, formulas, risks and practical tips for beginners.


