

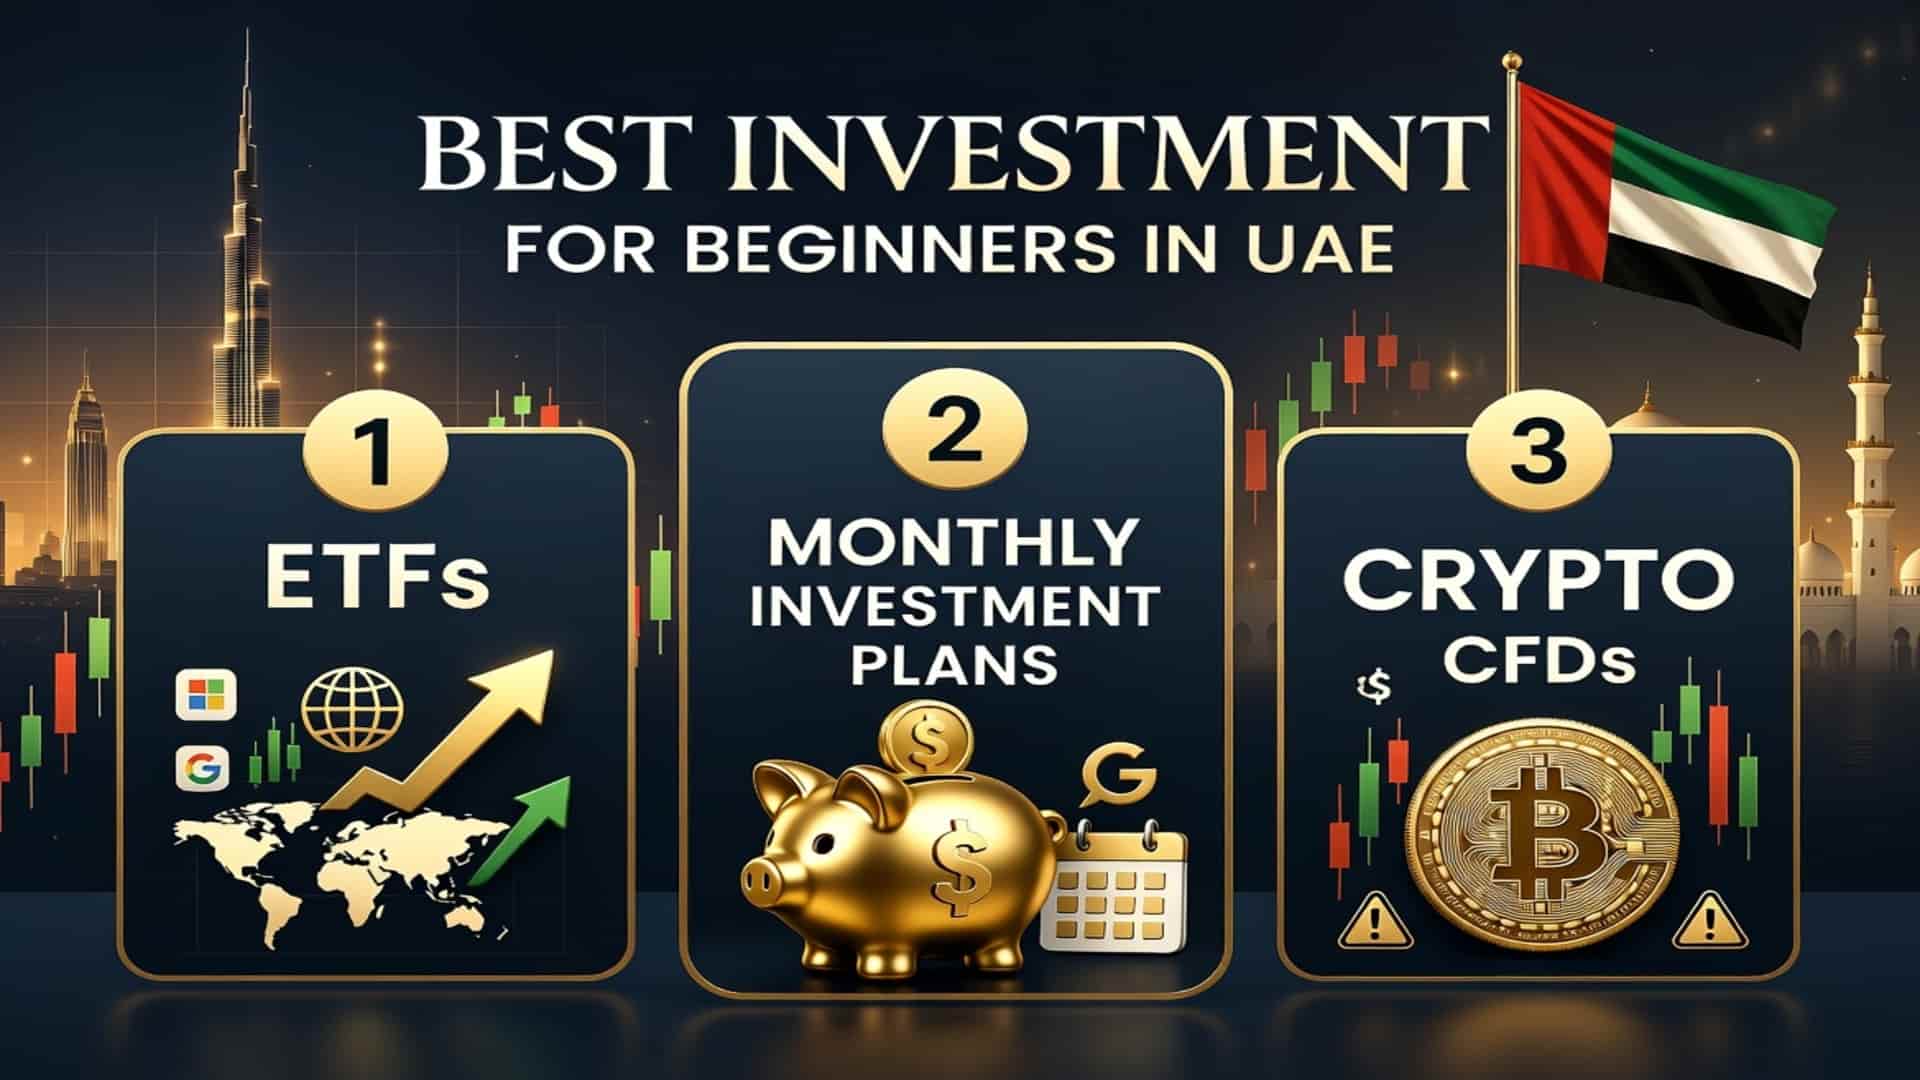
Best Investment in UAE For Beginners: The UAE has become one of the most dynamic financial centers in the Middle East, attracting a growing number of beginner investors.
Global ETFs Introduction 2026: Through a single product, market participants gain exposure to industries, commodities, and corporate sectors spread across different regions.
South Africa mining stocks analysis: The country’s economy was built on the discovery of gold, diamonds, and mineral wealth, and mining continues to play a major role in exports, employment, industrial growth, and foreign investment.

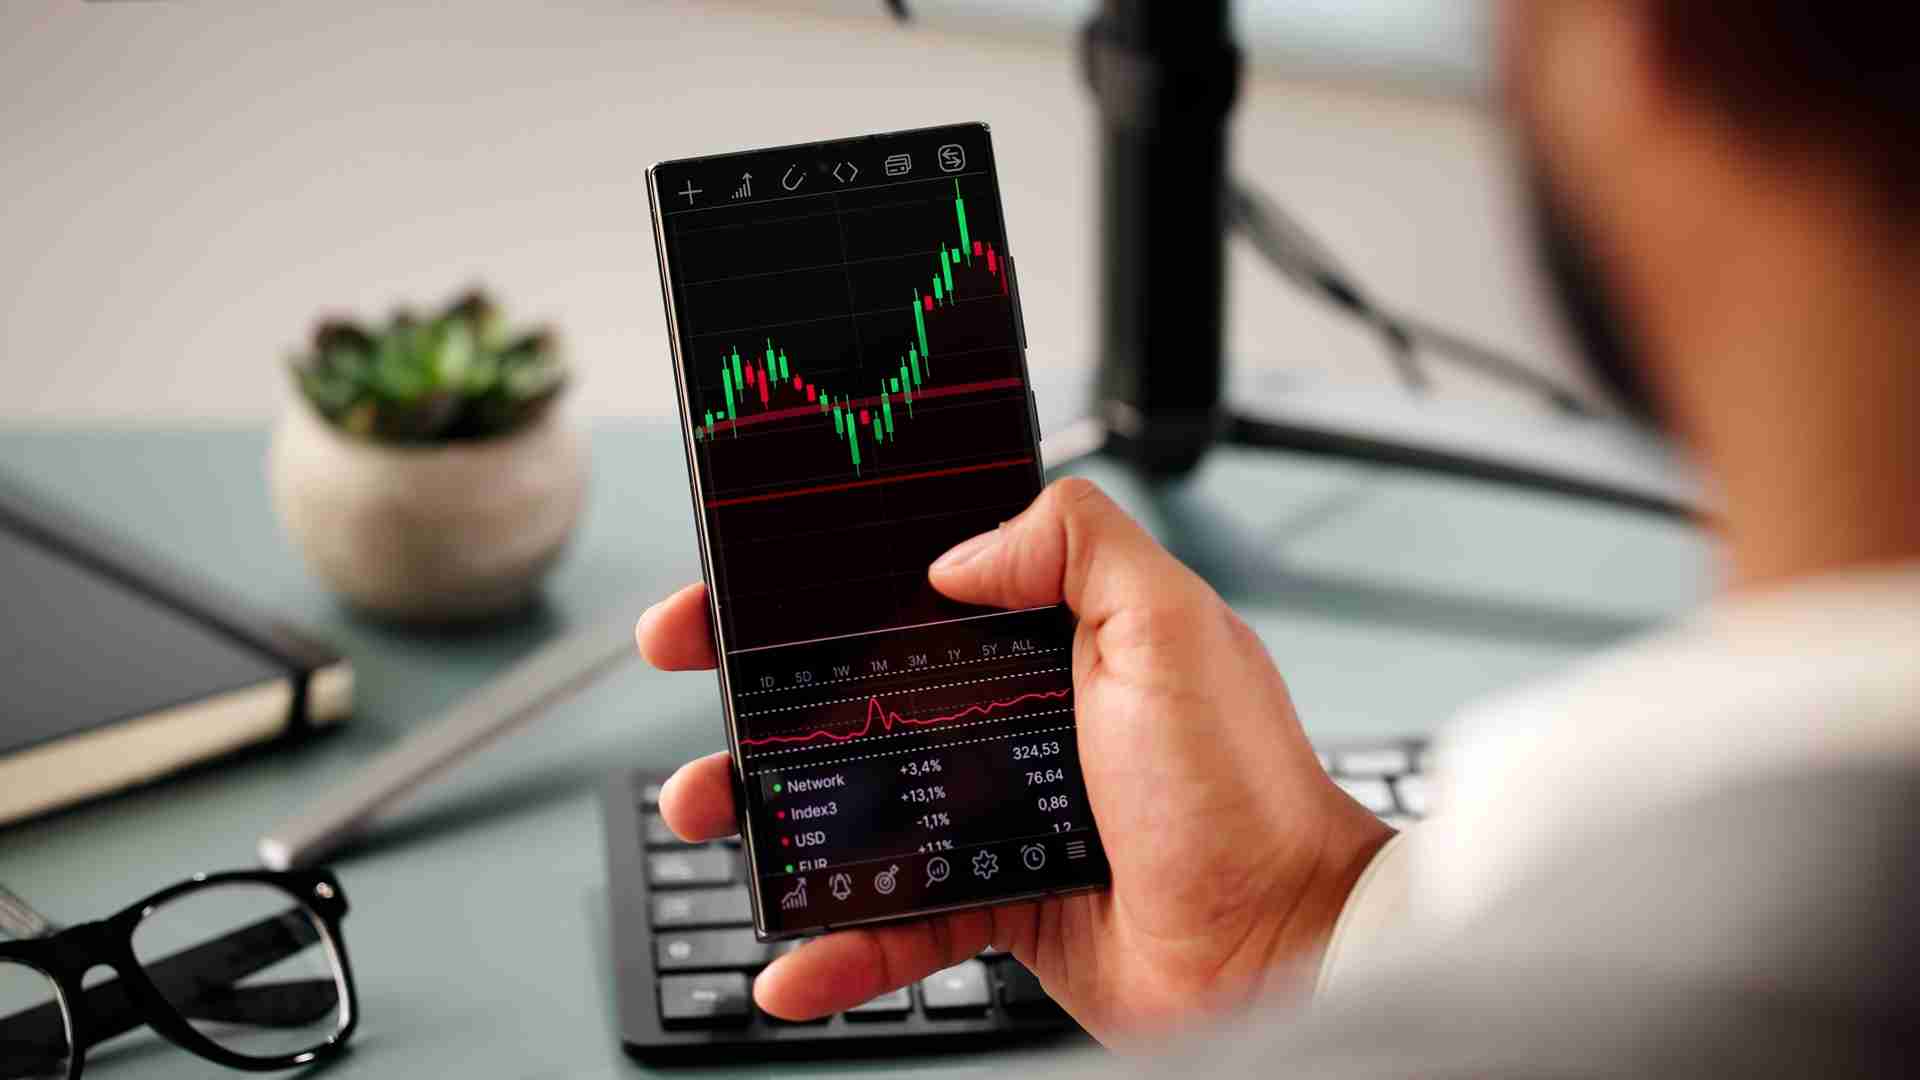
Forex market analysis: As of May 20, 2026, the EUR/USD pair is trading around 1.16, and this reflects recent modest declines amid ongoing adjustments in global currency markets.

Qatar Stock Exchange (QSE) analysis: The Qatar Stock Exchange is one of the leading financial markets in the Middle East.
CFD Trading for Beginners in Egypt: More beginner traders are entering the global financial markets through CFD platforms because they offer access to forex, stocks, indices, gold, oil, and other financial instruments from a single account.

Shiba Inu Price Prediction: Shiba Inu, commonly known as SHIB, has become one of the most recognized cryptocurrencies in the world.

Is ARM a good stock to buy: Arm Holdings PLC is best known for designing chip architectures used in smartphones, tablets, laptops, cloud servers, and artificial intelligence systems.
What is the BNB in Binance: Launched by the Binance exchange in 2017, BNB has grown from a simple utility token offering trading fee discounts into a powerful asset that drives the entire BNB Chain ecosystem.
What are the best SPY ETFs: Instead of researching and purchasing individual companies one by one, ETFs allow market participants to gain exposure to entire sectors, industries, or indexes through a single investment vehicle.
Top 10 forex brokers in South Africa for beginners: South Africa has become one of the most active forex trading markets in Africa, with thousands of new traders entering the market every year.
Dow Jones Index today analysis: The Dow Jones Industrial Average remains one of the most influential stock market indices in the world.
Recent financial disclosures reveal that JD Vance has increased his investment exposure to the technology sector through a growing position in the Invesco QQQ Trust.

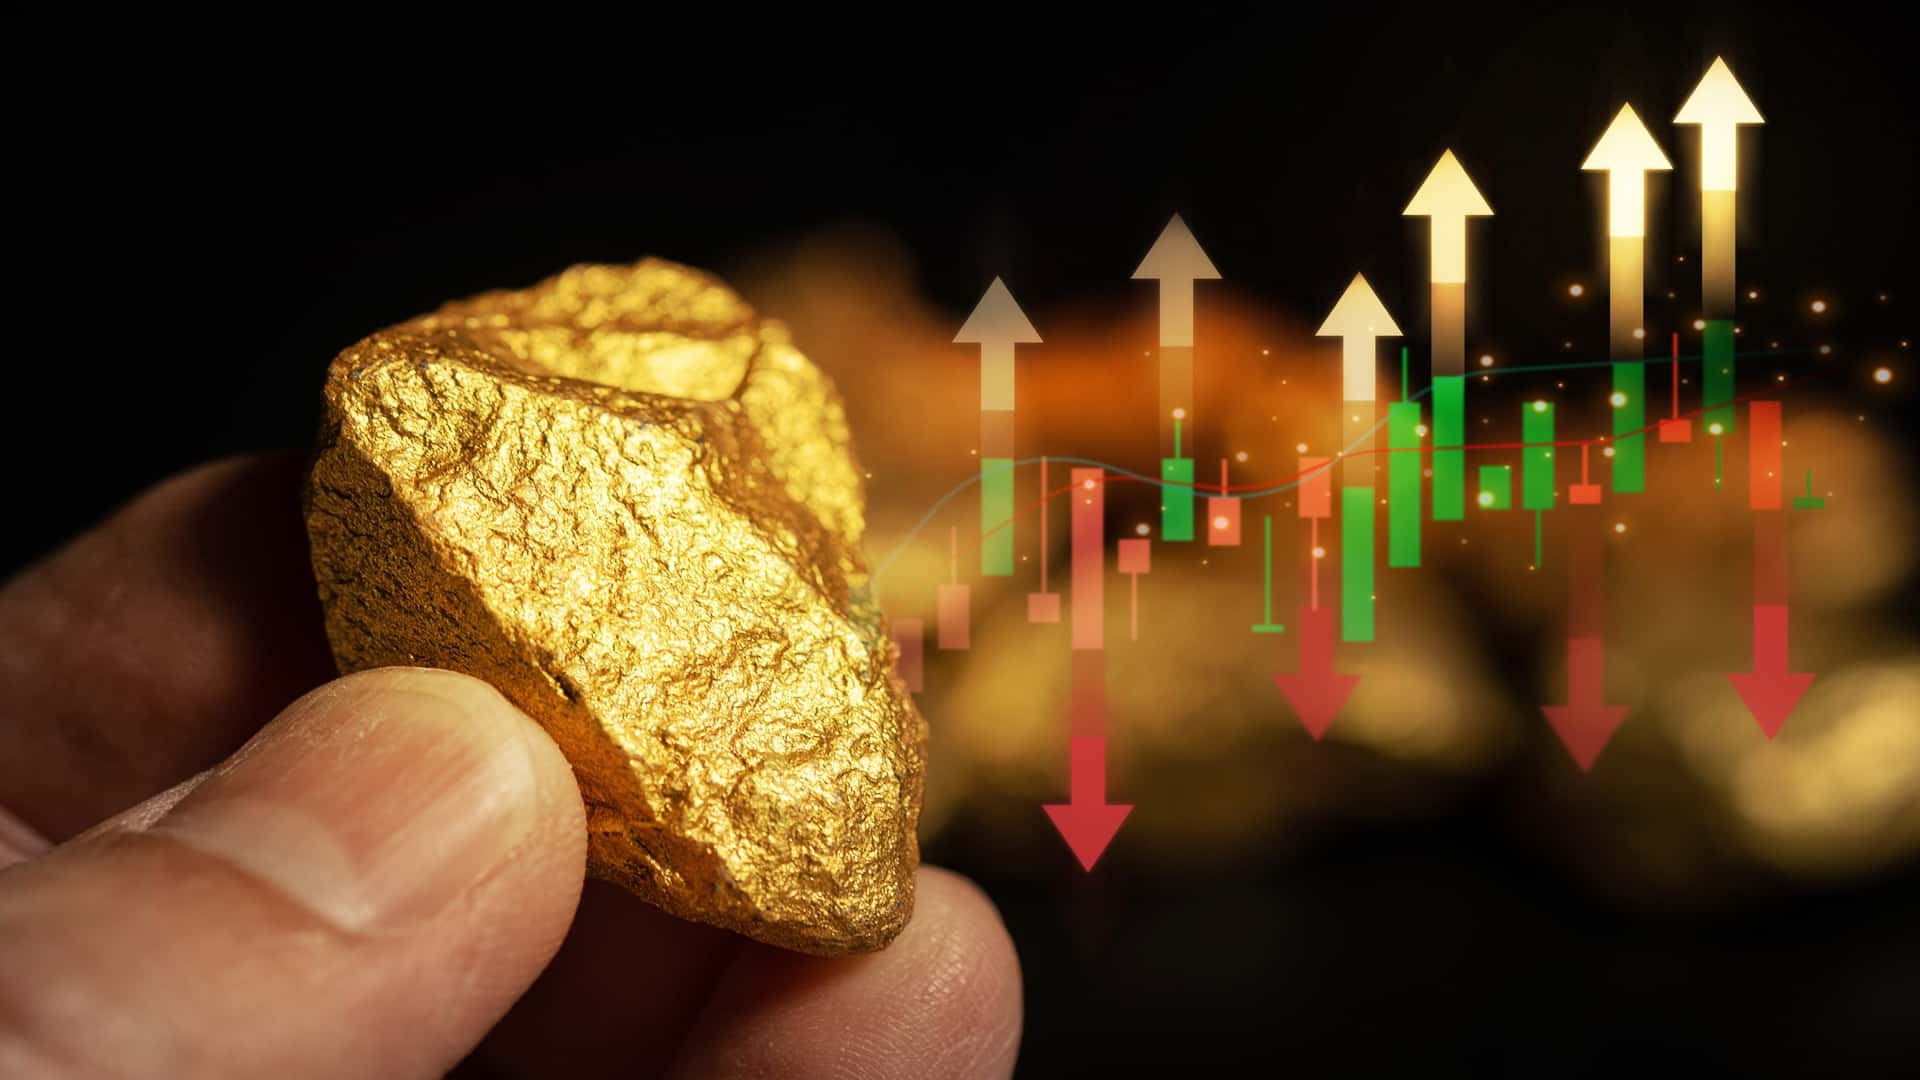
Gold Price Today: Gold prices moved higher on May 21 as investors increased demand for safe-haven assets amid growing uncertainty in global financial markets.
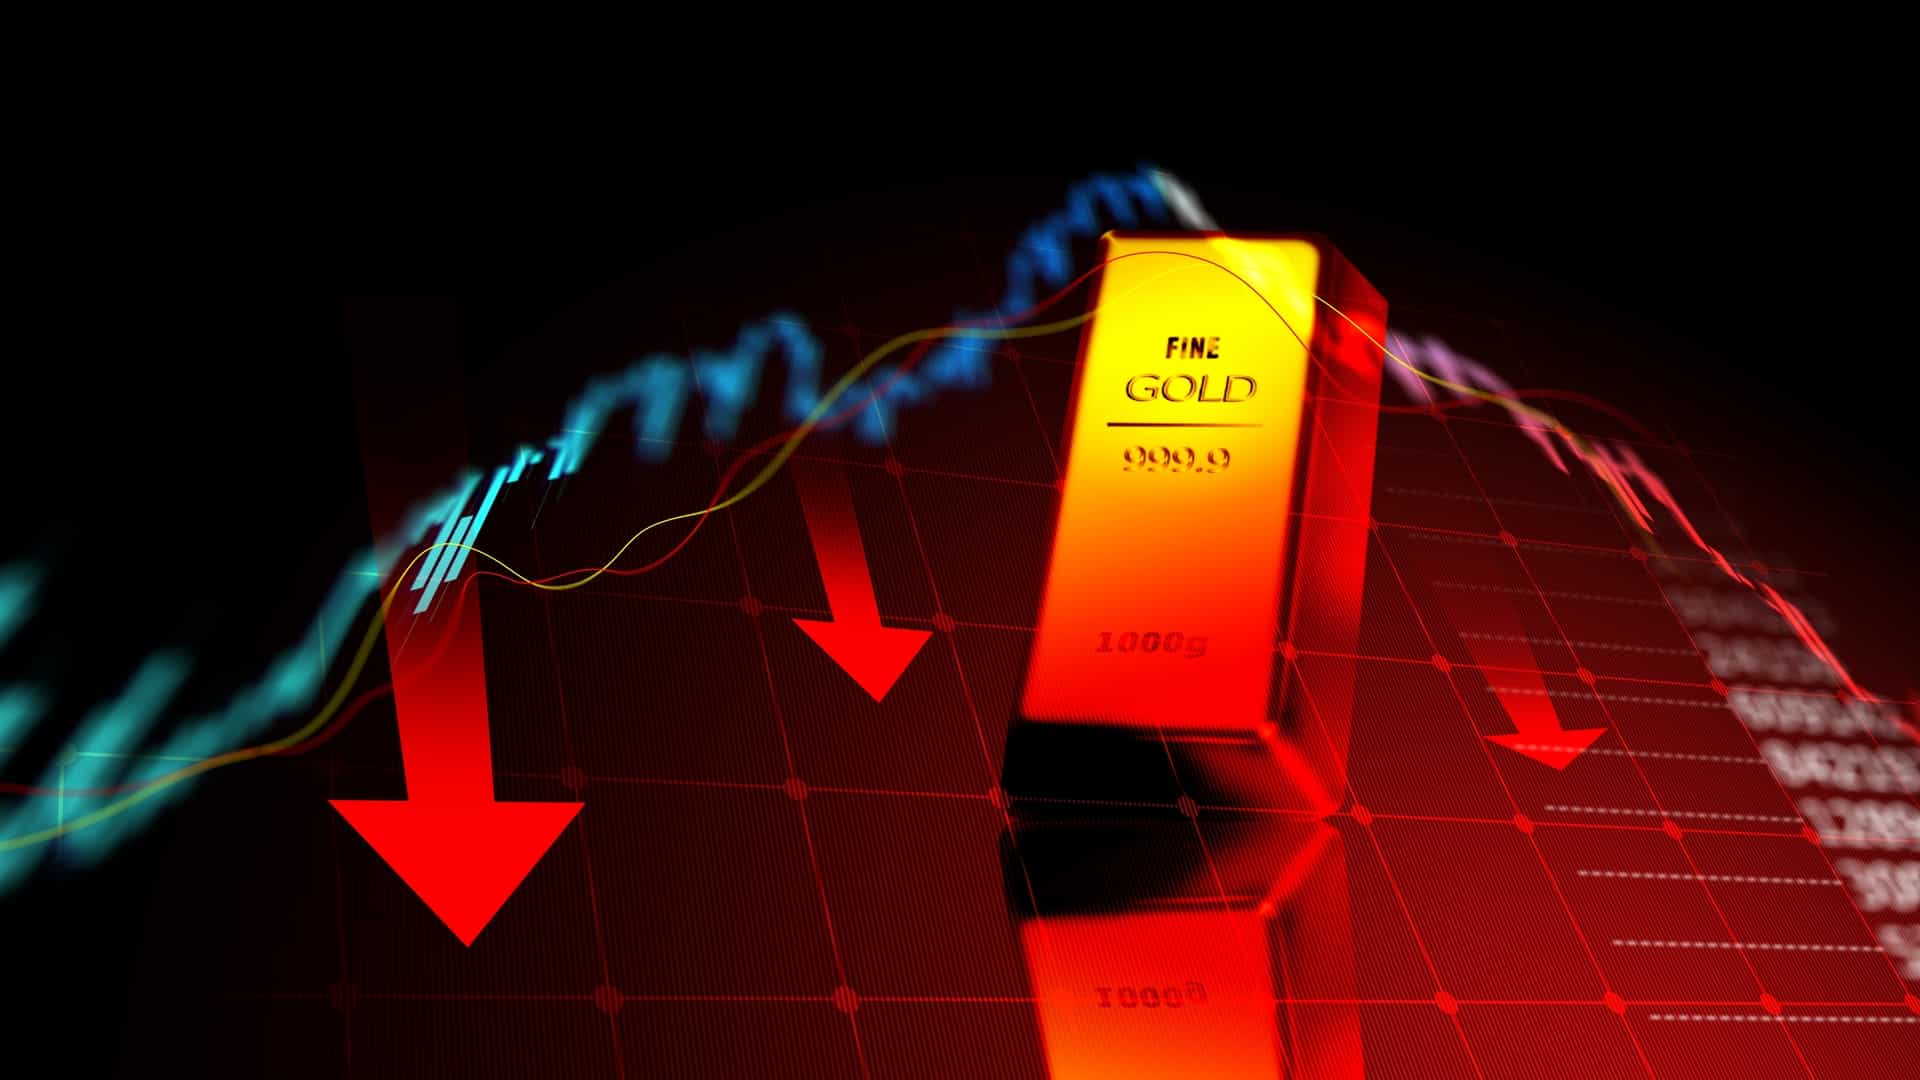
Gold Price Today: Gold prices moved lower on May 20 as XAU/USD dropped below the important 4,500 level, reflecting growing pressure from stronger bond yields, a firmer U.S. dollar, and cautious investor sentiment.
Learn the top 10 trading indicators in 2026 , how they work, how to combine them, and how to use them for trend, momentum, volatility, and CFD risk analysis.

Learn how to use the ADX indicator to measure market trend strength, confirm breakouts, and filter weak ranges. Master the Average Directional Index today.
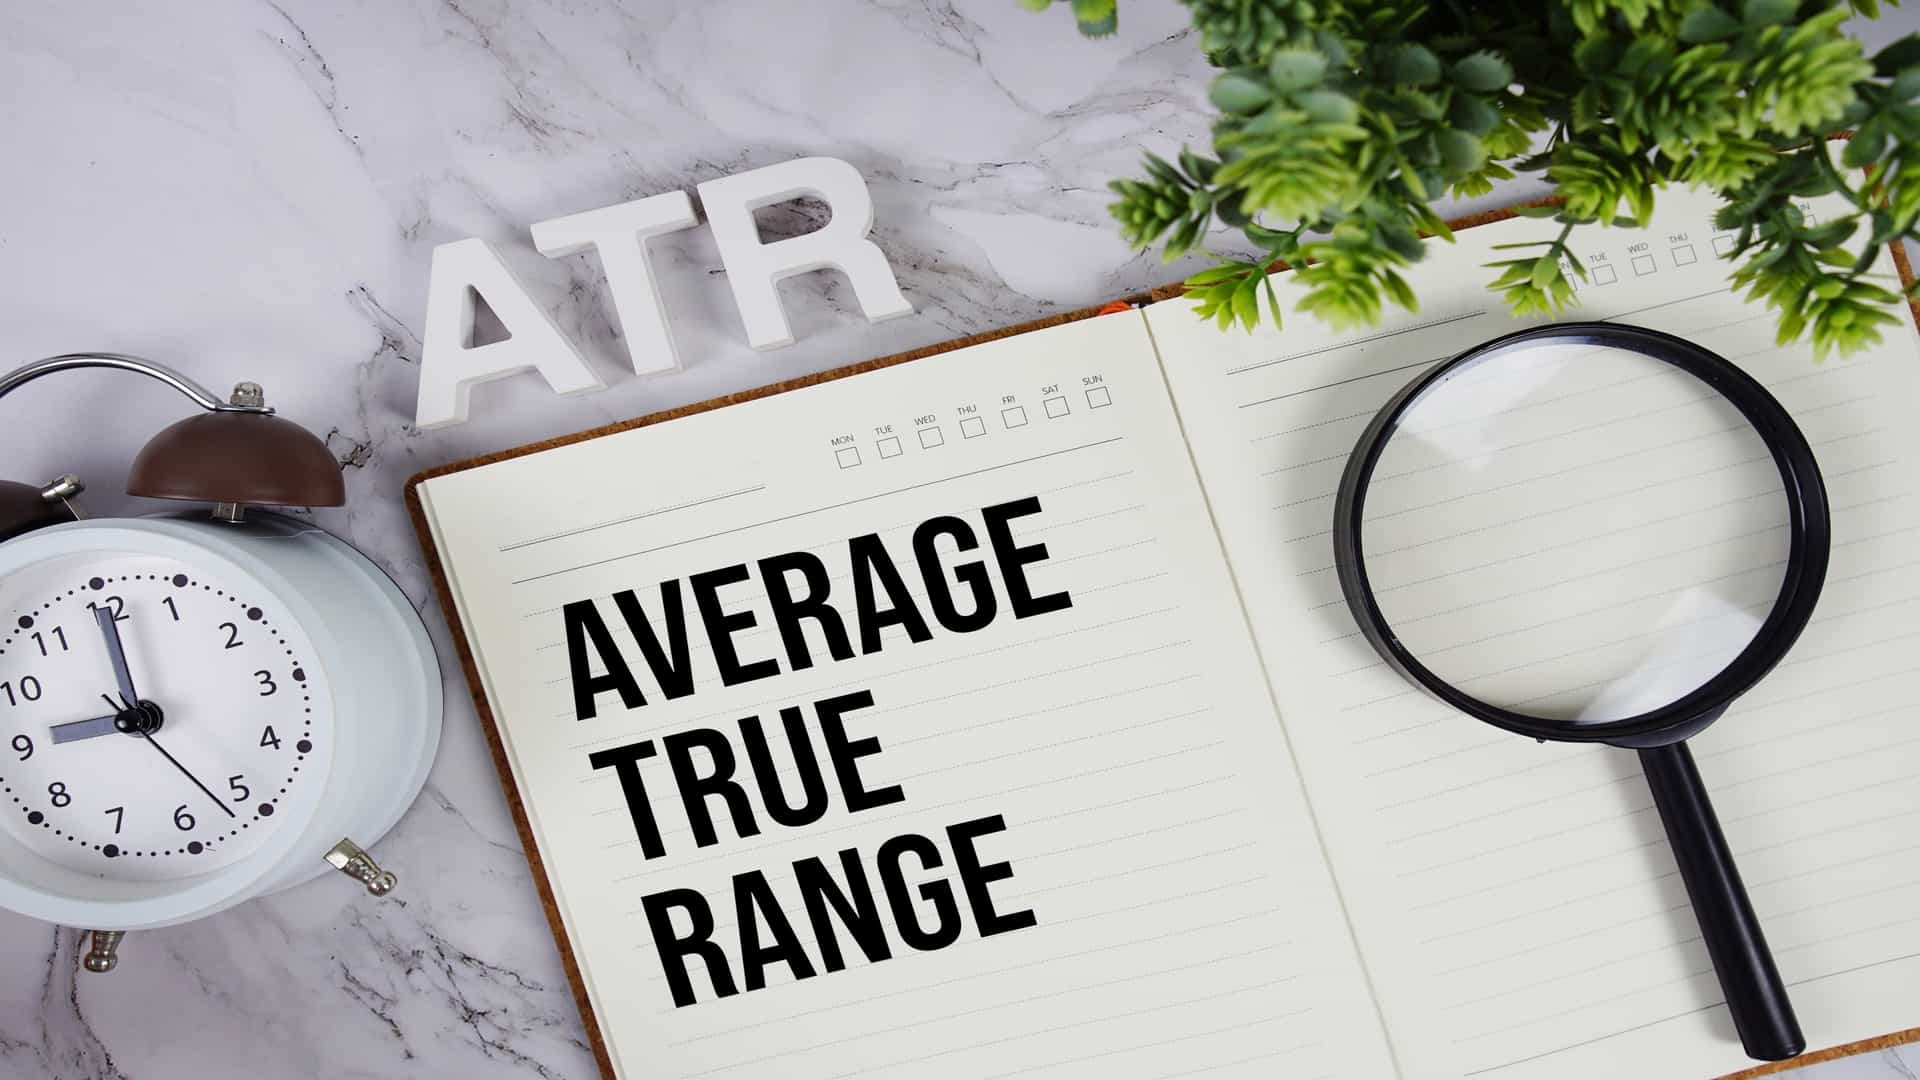
Learn what Average True Range is, how the ATR indicator works, and how traders use it for volatility, stop-loss planning, and risk management.


