

USD/CAD holds near 1.4000 as weaker oil prices pressure the Canadian dollar, while Fed policy risk and overbought RSI shape the technical outlook.
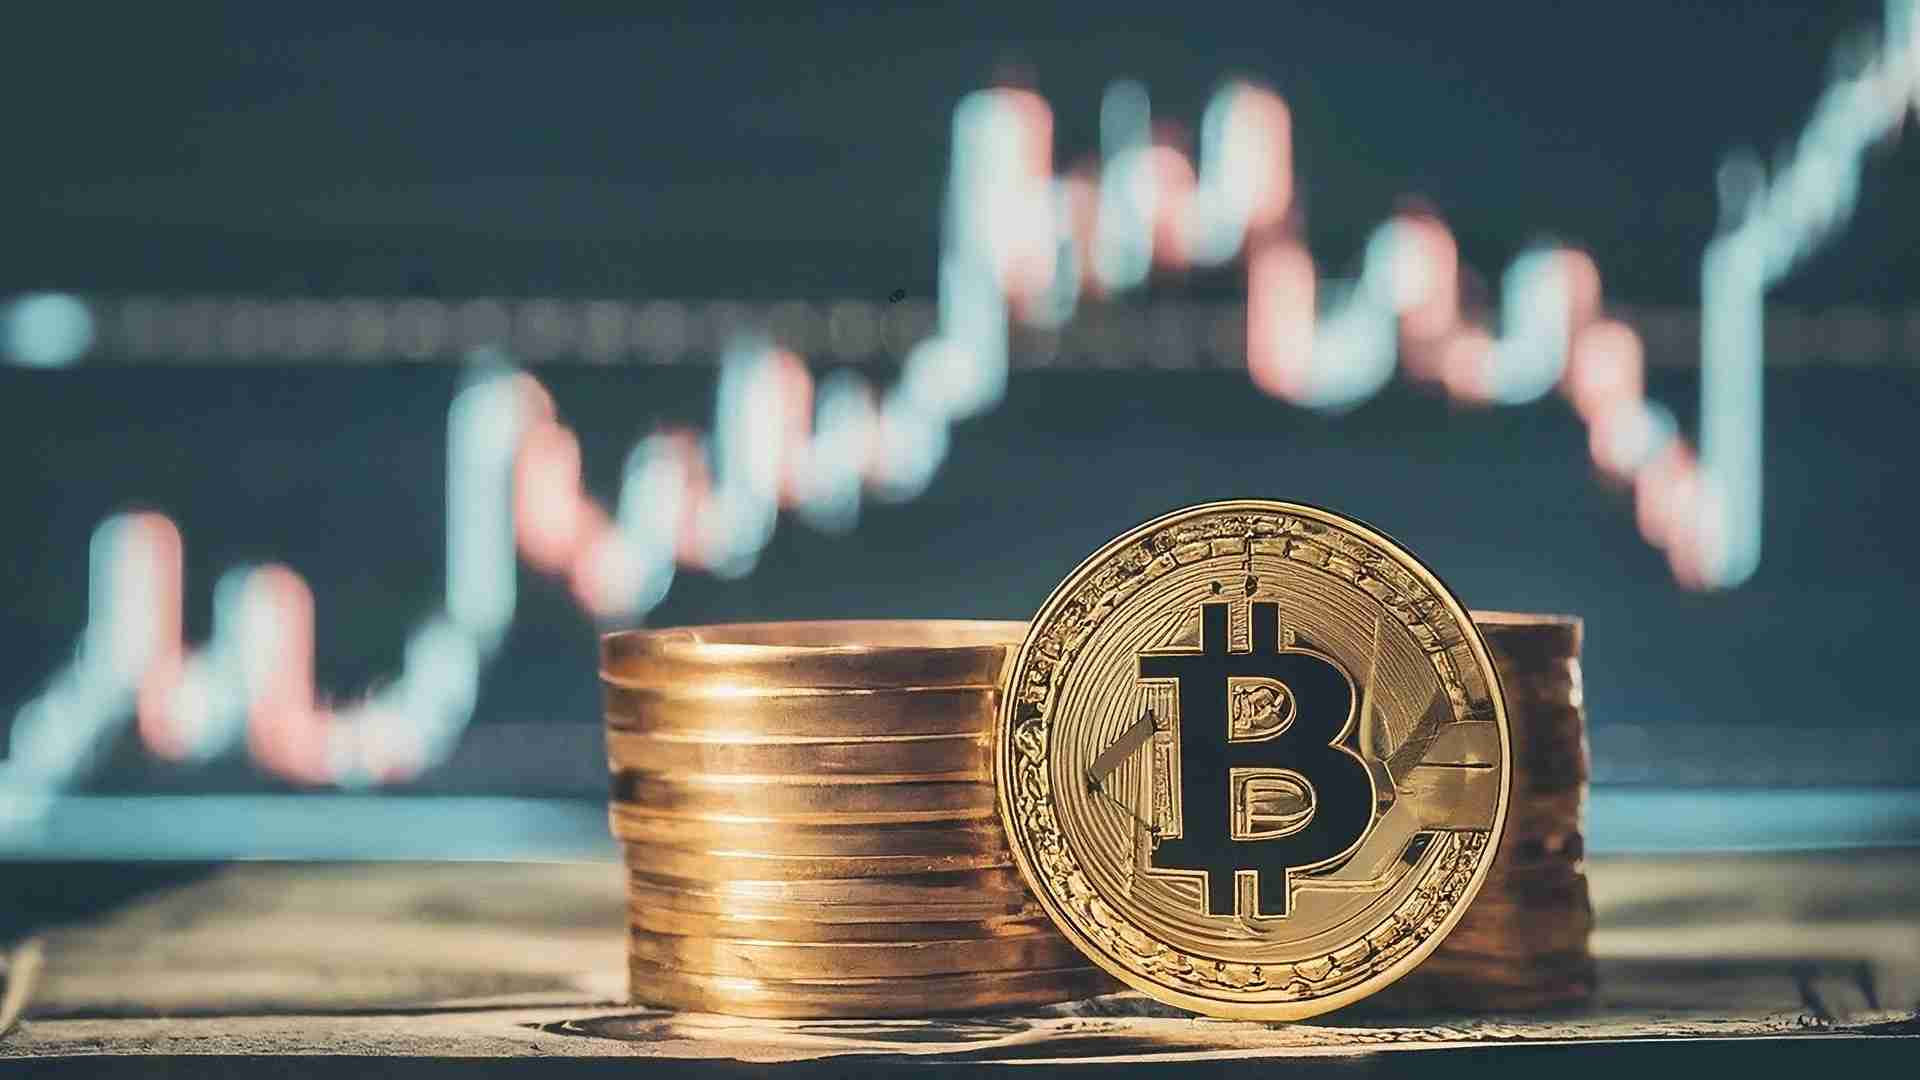
Analysis of how Kevin Warsh’s possible shift away from Fed dot-plot guidance could affect Bitcoin, liquidity, risk appetite and long-term crypto sentiment.
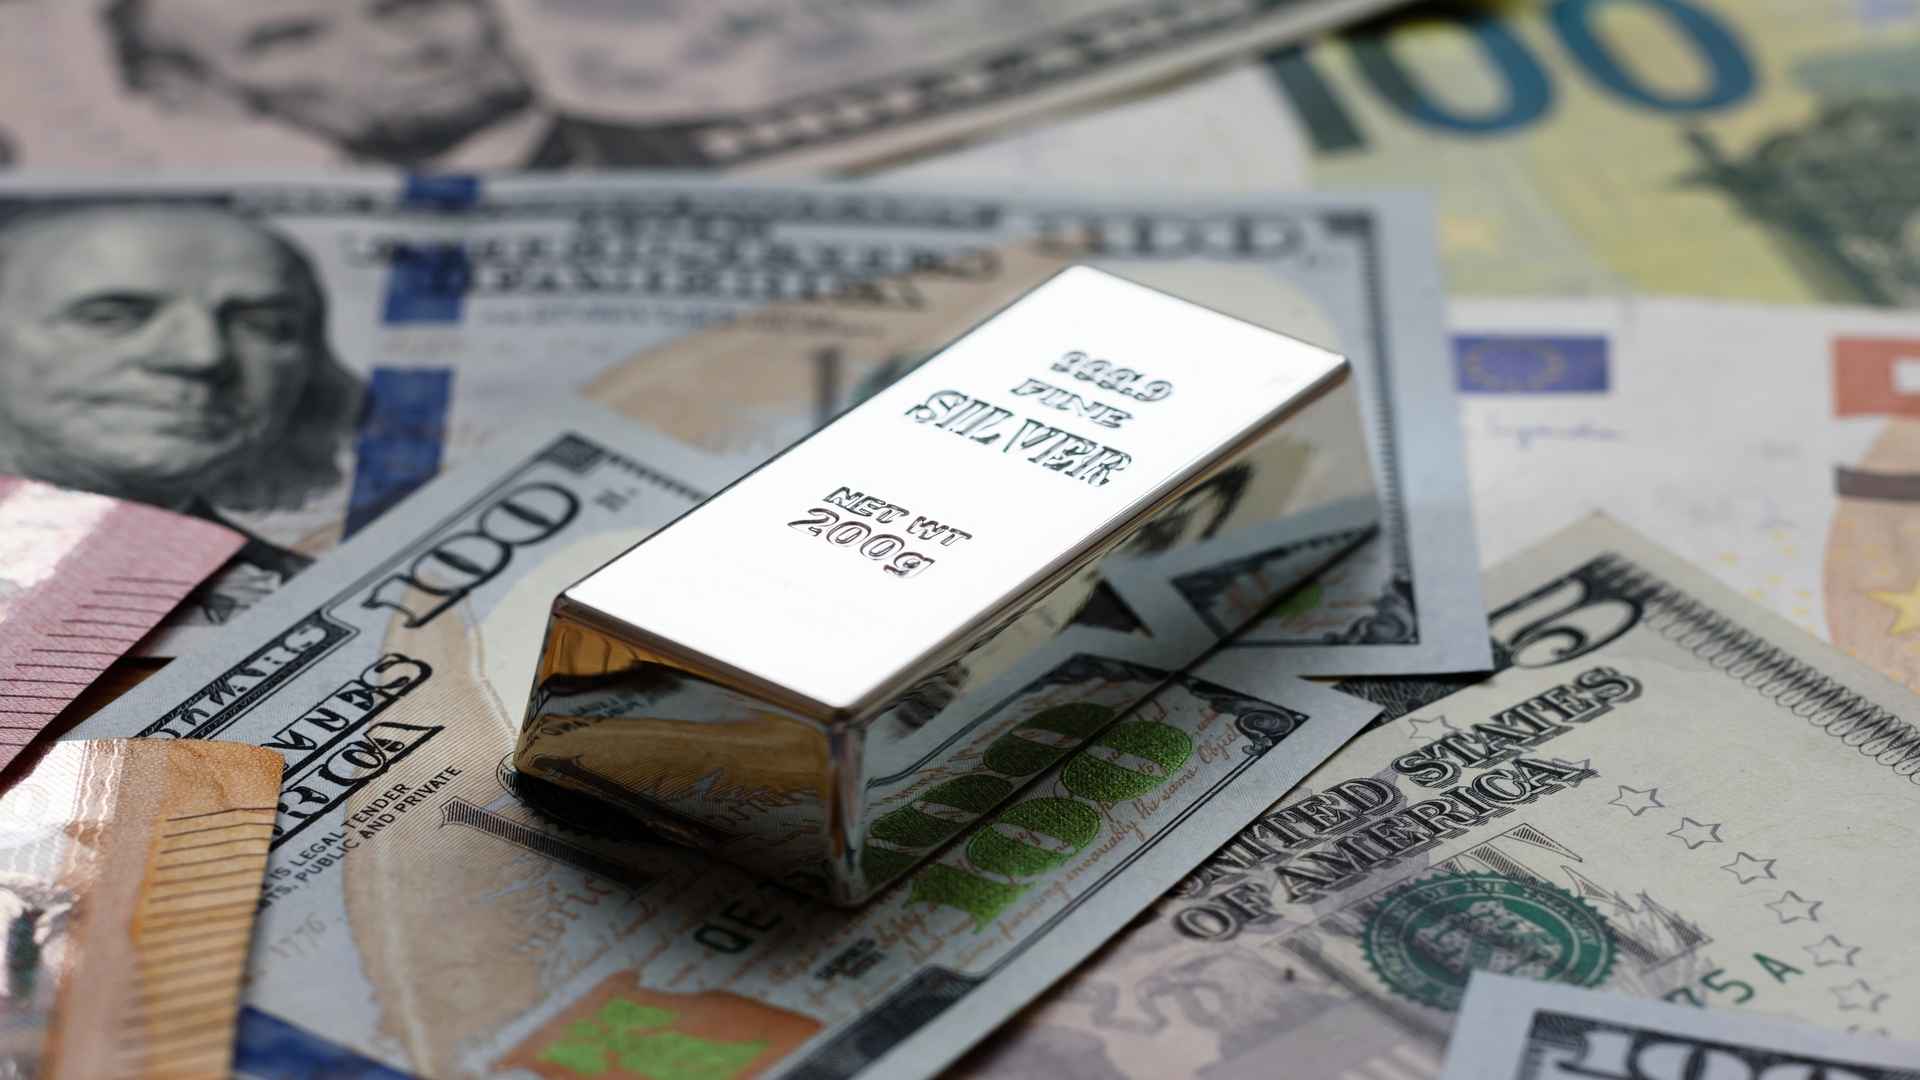
An in-depth analysis of the XAG/USD silver price forecast, exploring the impact of the US-Iran peace framework, Fed rate decisions, and crucial technical levels.
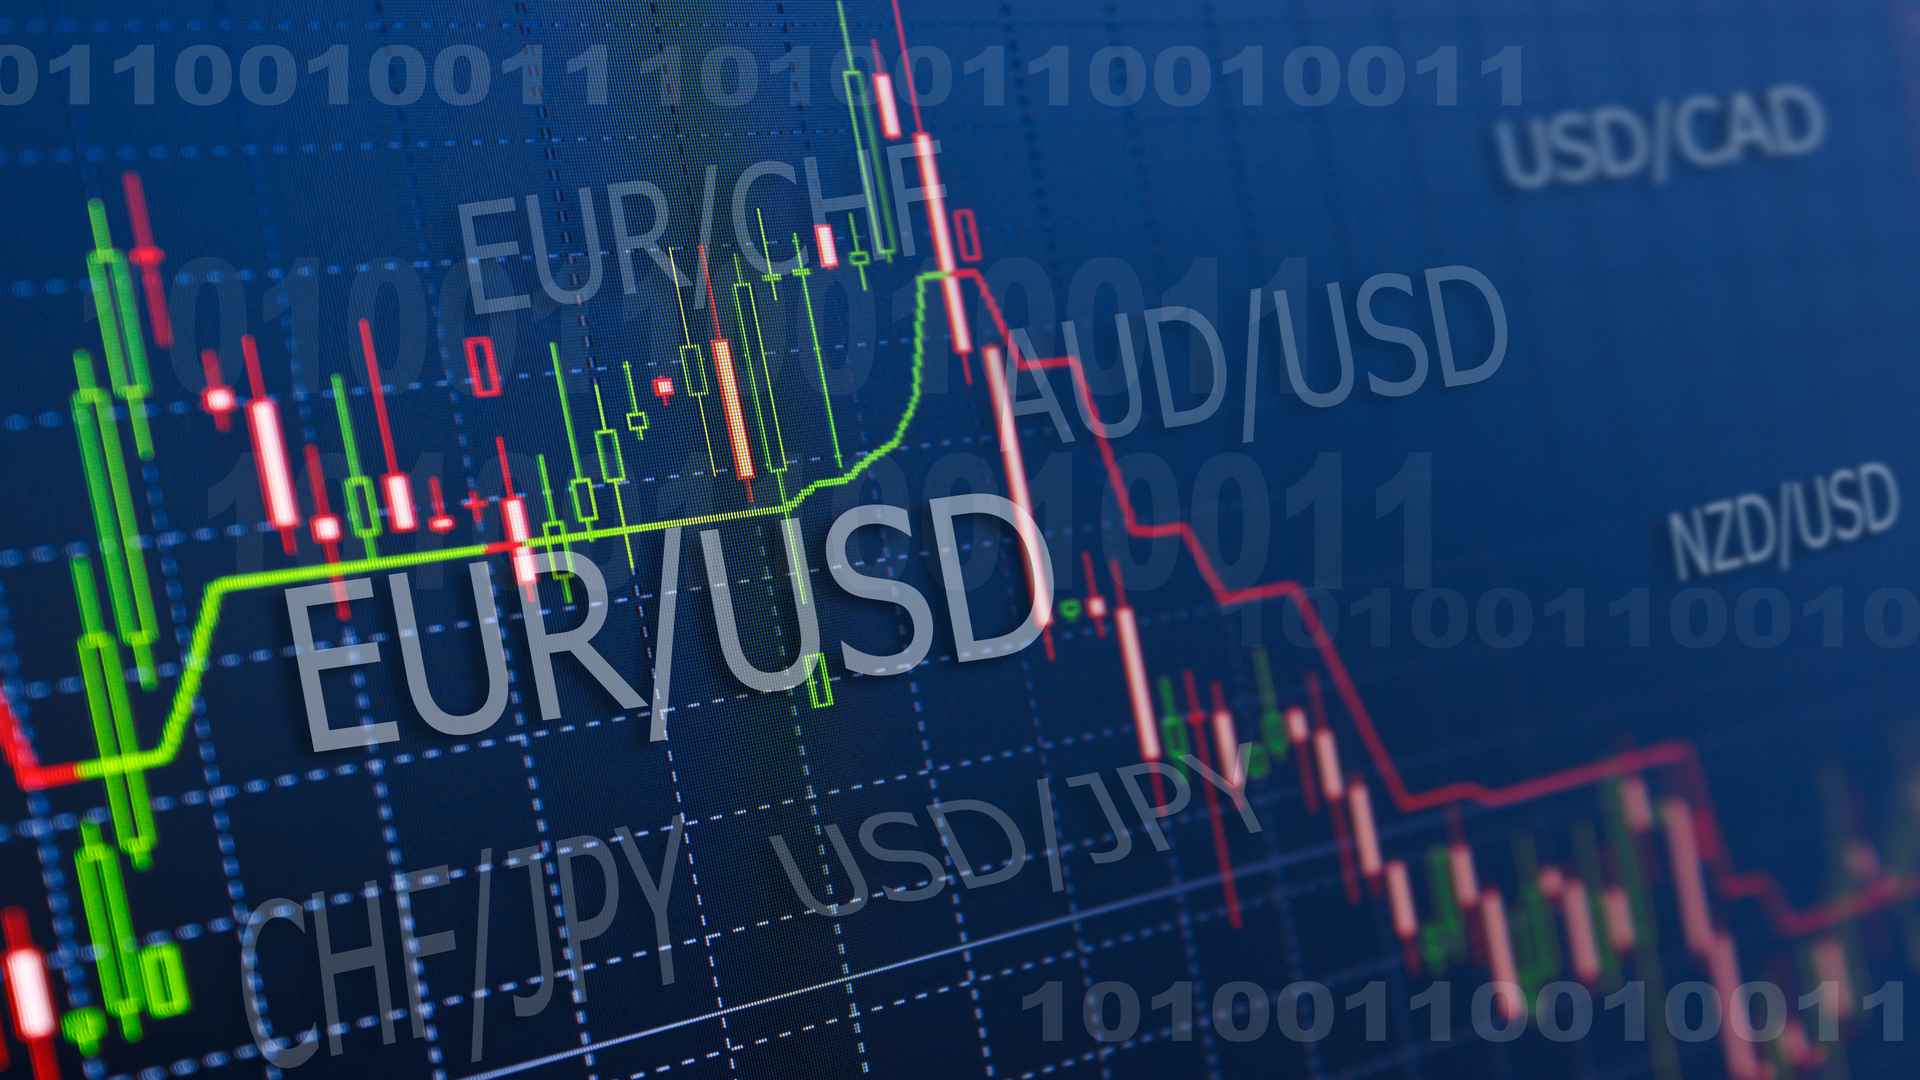
EUR/USD trades near 1.1580 as the Dollar strengthens before the Fed decision, while ECB inflation risks and key technical levels remain in focus.
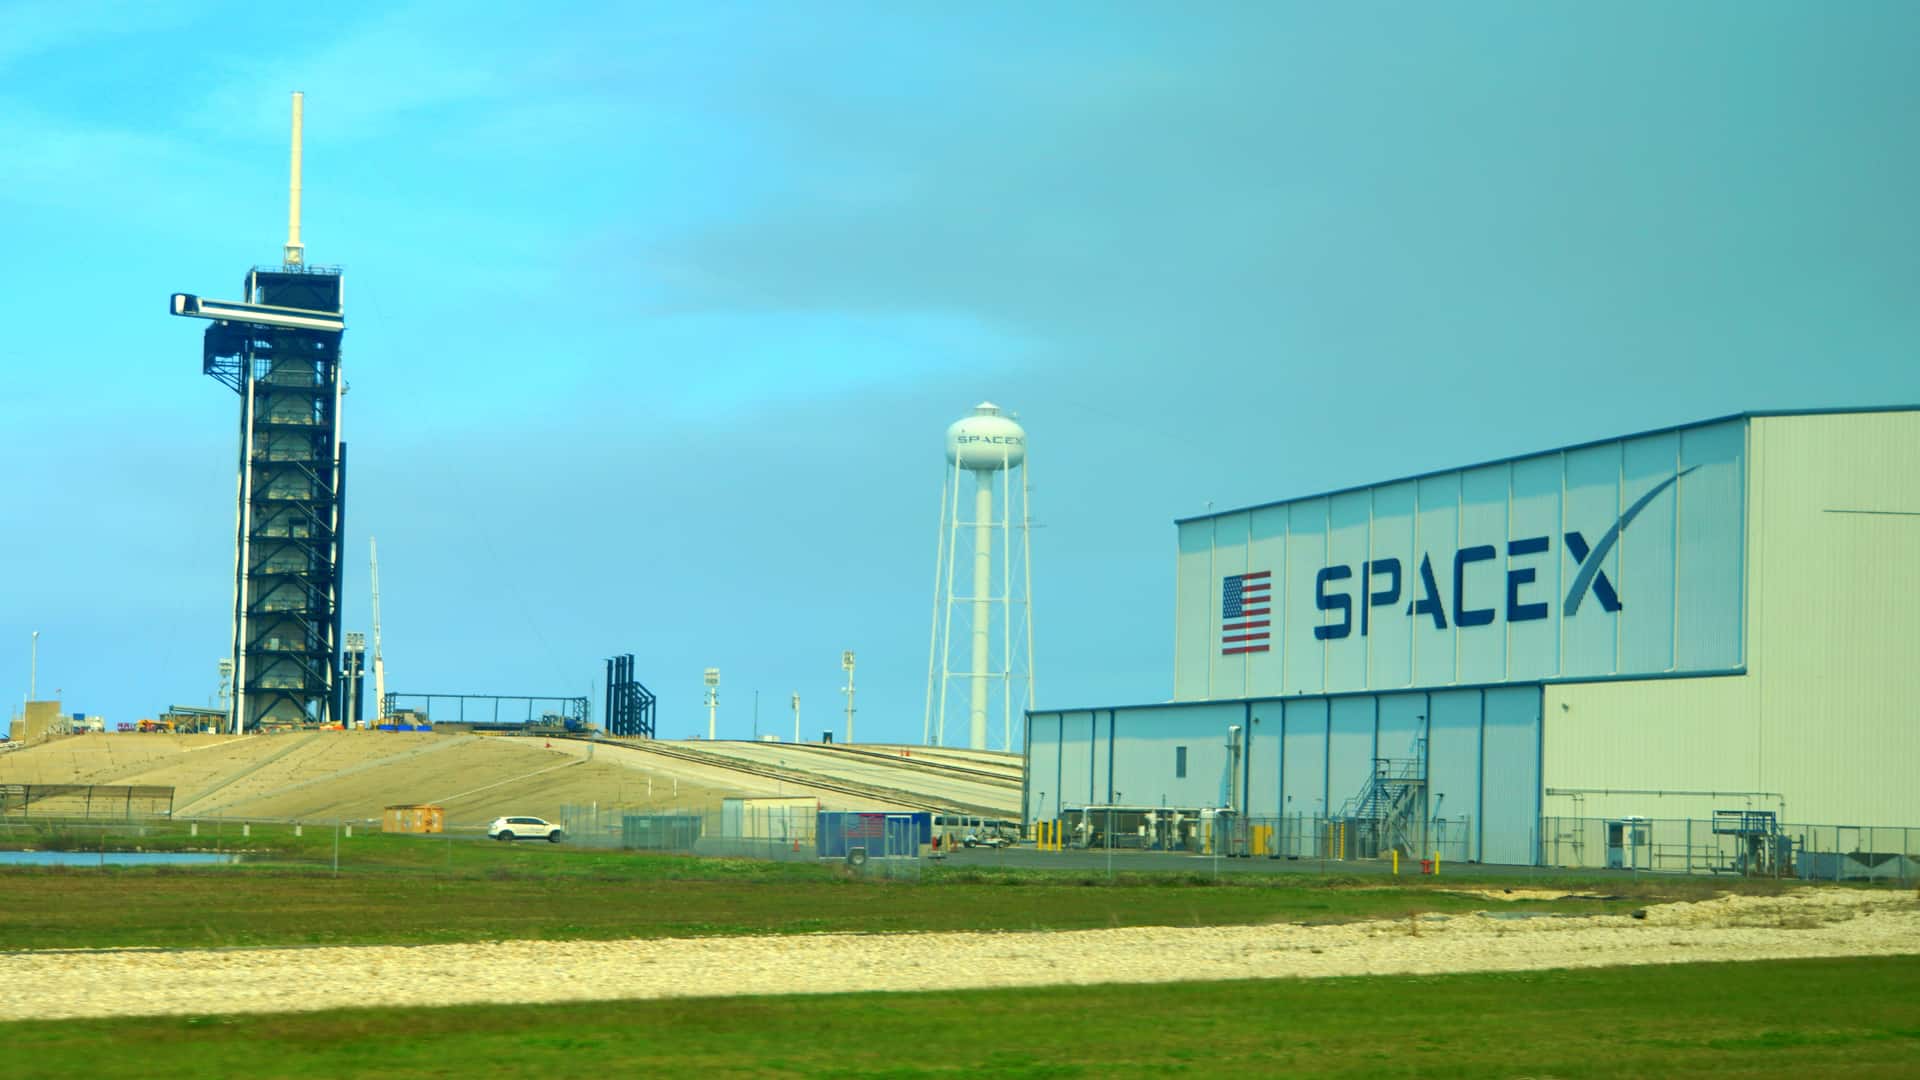
SpaceX's record $75B IPO and $2 trillion valuation make it the 6th-largest US public company. Here's why this AI-and-space watershed matters for GCC CFD traders — and how to access the megatrend on Markets.com.
After SpaceX's record $75B IPO and SPCX debut from $135 to $161, discover actionable CFD strategies for Middle East traders — momentum, breakout, scalping, swing and hedging in AED terms on Markets.com.
Saudi PIF, Kuwait's KIA, Qatar's QIA and Abu Dhabi's Mubadala poured an estimated $15–17B into SpaceX's record IPO. Here's what heavy Gulf backing signals — and how Middle East traders can ride SPCX via CFDs in AED/SAR on Markets.com.

Japan and South Korea stocks recovered from early losses, with the Nikkei hitting a fresh record high and KOSPI rising over 1.5% as chip shares rebounded.
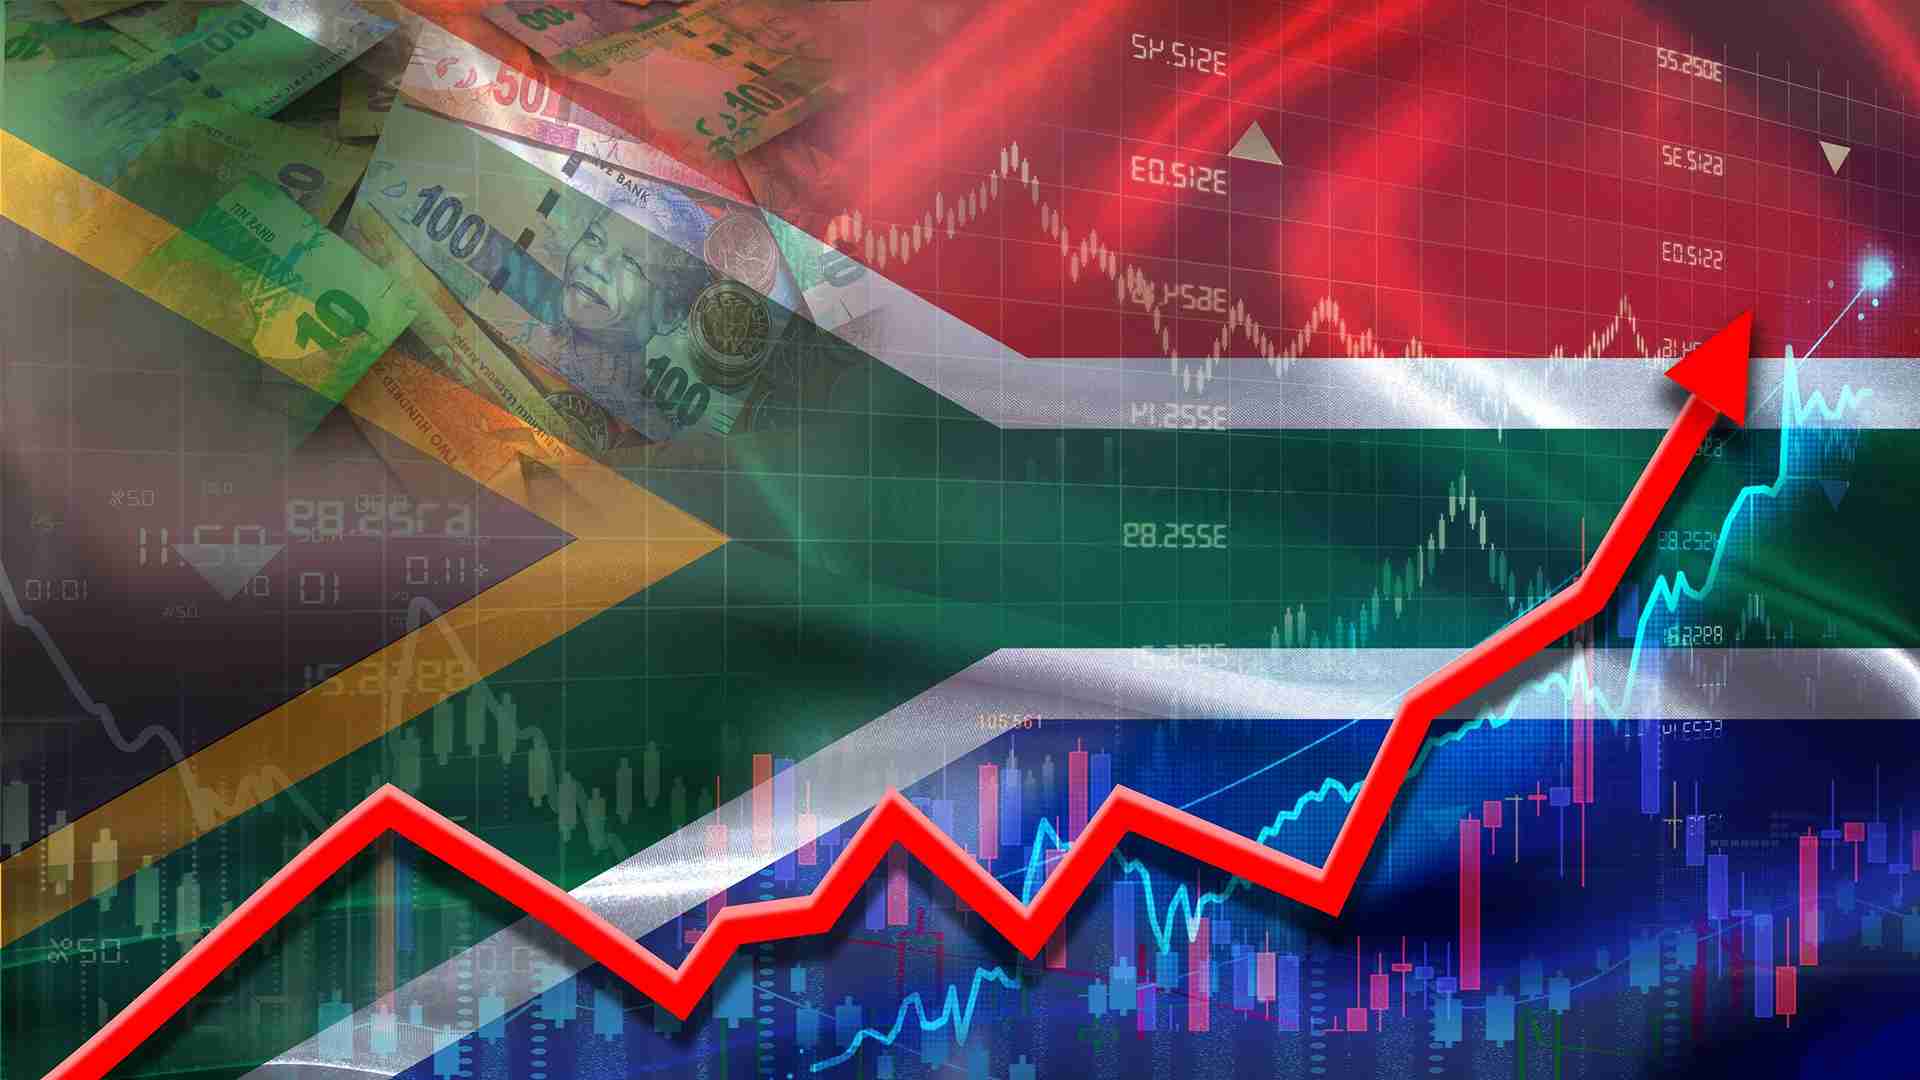
SpaceX (SPCX) closed +19% on debut and is now the 6th-largest US company inside the Nasdaq 100. Here are 5 ways South African CFD traders can trade the aftermath in ZAR via Markets.com.
A practical, step-by-step guide for South African traders: how to trade the SpaceX (SPCX) IPO using CFDs in rand. Long vs short, leverage, margin, spreads, stops and demo trading on Markets.com.
SpaceX’s expected IPO raises questions over S&P 500 and Nasdaq-100 inclusion as investors assess index rules, profitability and valuation risk.
US CPI data is expected to show May inflation rising to 4.2%, with oil prices and Fed rate-hike bets in focus on USD and EUR/USD traders.
Gold holds near a one-week high as falling oil prices ease inflation concerns before the Fed decision. Traders watch Kevin Warsh’s first meeting as chair.
Brent crude dropped below $80 after US-Iran deal hopes eased supply fears, but falling inventories and Strait of Hormuz uncertainty keep rebound risks alive.
SpaceX shares extended their post-IPO rally, rising nearly 50% since listing as retail demand, limited float and record options trading intensified market volatility.

Learn how high-leverage forex brokers work, what 1:500 and 1:1000 leverage mean, and how to compare margin, spreads, risks and regulation.
Learn how forex trading tax in South Africa works, including SARS treatment, marginal tax rates, provisional tax requirements, records, and CFD risks.
Learn trading session time in South Africa, including forex market hours in SAST, key session overlaps, best trading times and trading risks.


