

Microsoft is experiencing its worst quarterly performance on Wall Street since the 2008 financial crisis, largely due to investor disappointment regarding its AI prospects. Despite its dominance in productivity software and Windows, the company faces dual pressures to achieve efficient AI growth and build supportive cloud infrastructure. This comes as AI triggers a 'SaaS-pocalypse' for software stocks. This analysis delves into the challenges surrounding Copilot, managerial adjustments, the resilience of Azure, and intensifying AI competition, featuring an optimistic outlook from CEO Satya Nadella.
This article examines how Iran, despite significant losses, has managed to leverage its control over the Strait of Hormuz for strategic gains. Iran's proposal to levy transit fees on ships threatens to disrupt the global economy and create a new revenue stream for the regime. The analysis explores the challenges facing the US in confronting this threat, the limitations of military solutions, the possibility of high-stakes negotiations, and the broader implications for regional countries and Asian and European markets.
After a significant sell-off, the gold market is showing signs of recovery, holding onto its annual gains and extending its multi-year, record-breaking bull run. This article examines the causes of the recent downturn, the roles of central banks and ETFs, the structural drivers supporting gold, and the future outlook in the face of geopolitical and economic challenges.
Meta Platforms is facing increasing challenges in proving its dominance in the AI arena, with recent legal developments adding a layer of uncertainty. However, some Wall Street analysts view these fluctuations as a prime buying opportunity. The stock has fallen 19% year-to-date. Morgan Stanley's analysis suggests market sentiment has hit a bottom, with expectations of a higher stock valuation. Despite regulatory concerns regarding its advertising business model, AI advancements like 'MetaClaw,' the rollout of smart shopping tools, investments in startups, and cost-cutting plans support a positive outlook.
Analysis from Goldman Sachs suggests that intense selling pressure from hedge funds and systematic investors may be creating fertile ground for a significant rebound in US equities, particularly as geopolitical tensions ease. Record short-selling positions indicate a potential turning point.

AE as Global Gold Powerhouse: As we delve into 2026, the United Arab Emirates (UAE), particularly Dubai, has solidified its status as a global gold trading powerhouse.

Trade Desk (TTD) Analysis: As financial markets experience fluctuations, especially in the tech sector, investors are often on the lookout for optimal entry points.

Commodity market outlook: In recent trading sessions, West Texas Intermediate (WTI) crude oil has seen a remarkable increase of 4.5% to 6.3%.
Investing in US Stocks from South Africa: Investing in US stocks has become increasingly appealing for South African investors seeking diversification, growth opportunities, and access to some of the world's most successful companies.
How to Invest in Stocks for Beginners (Europe): Investing in stocks can be a rewarding venture for beginners in Europe.

Forex Market Today: The forex market is a dynamic environment where currency values fluctuate based on a multitude of factors such as economic indicators, geopolitical events, and market sentiment.

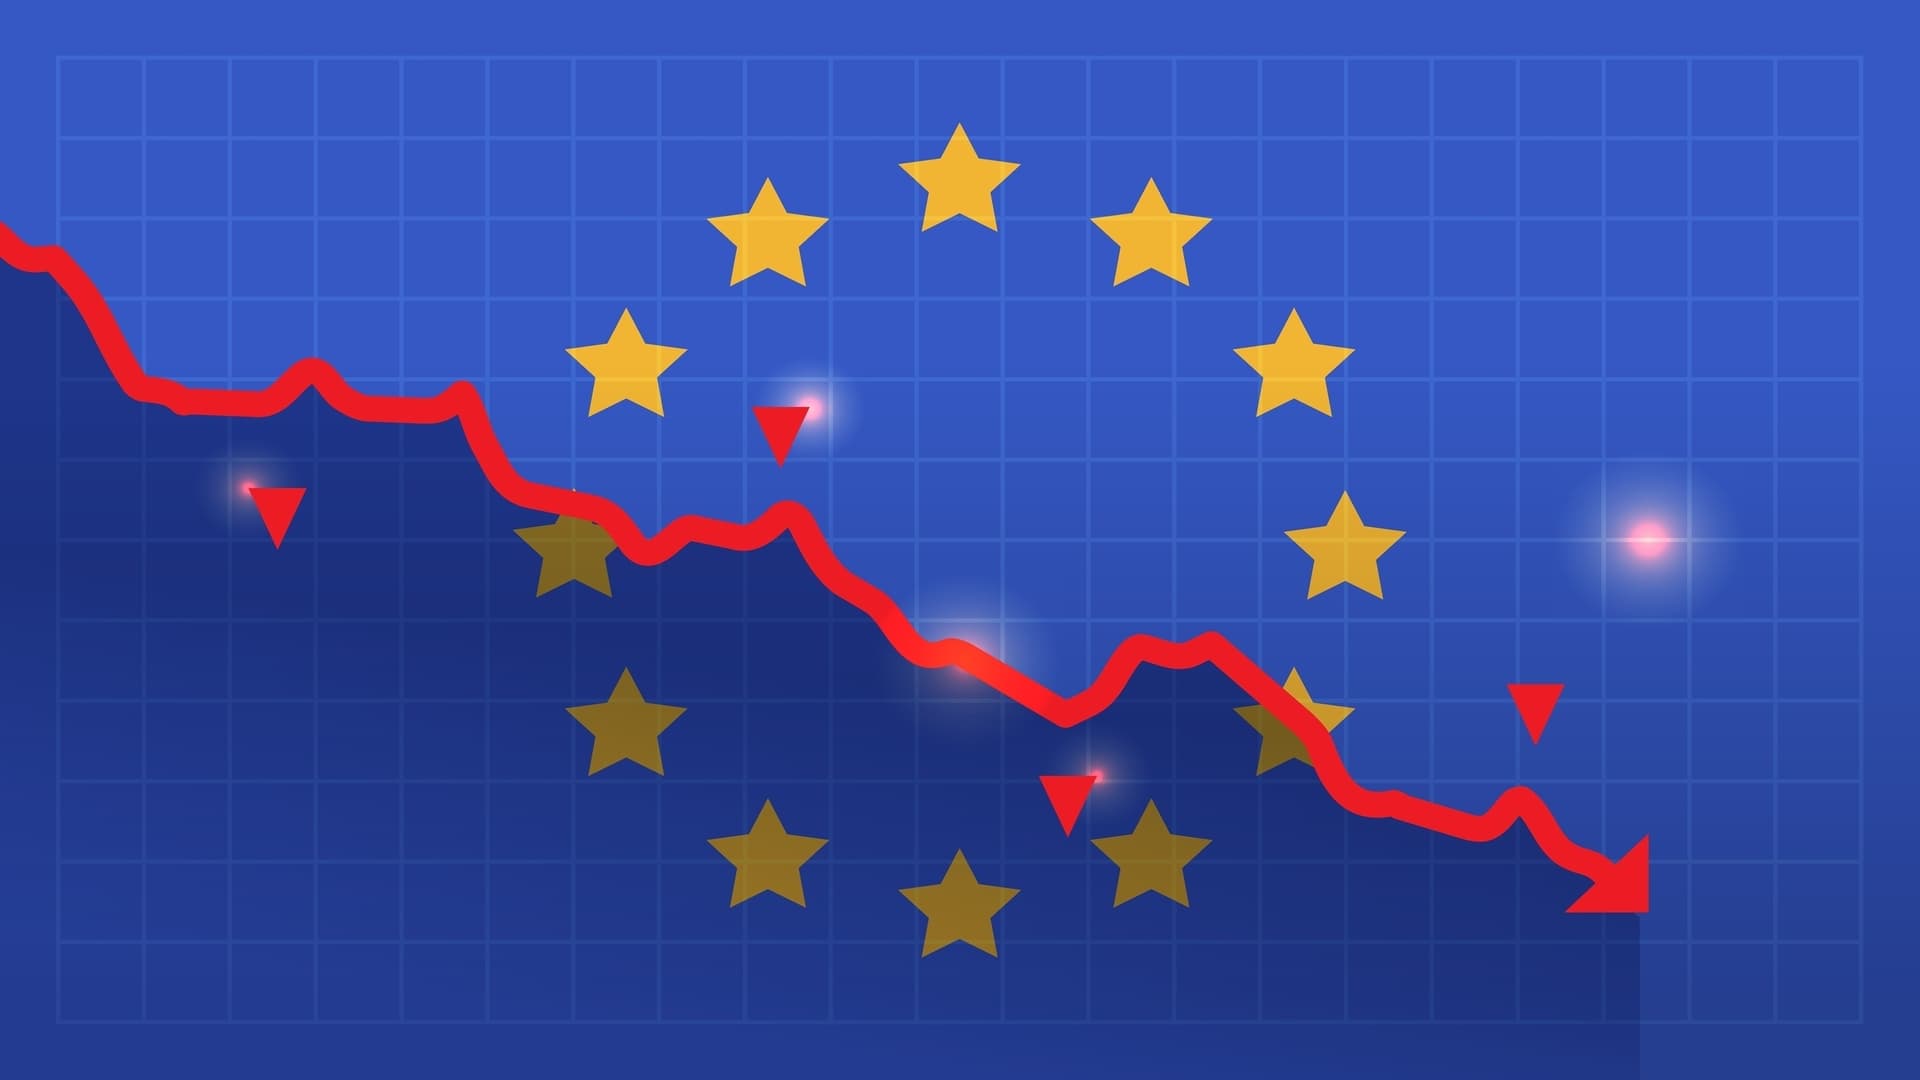
European Stocks Overview: European stock markets have recently faced significant downward pressure, primarily driven by escalating tensions in the Middle East.
The conflict between Iran and Israel is escalating in the digital arena. Reports reveal sophisticated attacks aimed at spreading panic, stealing data, and disrupting military capabilities. Extensive networks of actors, including the Islamic Revolutionary Guard Corps, contracted hacker groups, and even volunteers, are mobilized for these operations. While Israel and the US possess greater offensive capabilities, Iran excels in low-cost asymmetric attacks. This article explores the tactics, targets, and motivations behind this ongoing digital conflict.
In a recent interview, Warren Buffett expressed a lack of attractive investment opportunities in the current stock market, despite Berkshire Hathaway holding significant liquidity. Buffett strongly advocated for a zero inflation target, highlighting the detrimental effects of even 2% inflation. He also touched upon his early sale of Apple shares, praised Tim Cook's leadership, and supported the Federal Reserve's policies. Buffett avoided delving into details regarding Jeffrey Epstein, asserting he never met him, and indicated he would monitor future donations to the Gates Foundation. He also spoke about succession at Berkshire and his view on market downturns.
A federal judge has temporarily halted President Trump's ambitious $400 million project to build a new banquet hall at the site of the demolished East Wing of the White House, ruling that Congressional approval is a prerequisite. The decision came after the National Trust for Historic Preservation sued, alleging the administration overstepped its authority in demolishing the historic structure and commencing new construction without explicit legislative consent. Judge Richard Leon stated that the President acts as a "steward" of the White House, not its owner, and significant alterations require legislative backing. While Trump denounced the preservation group as "left-wing fanatics," administration officials maintained the project would be fully privately funded and serve to modernize infrastructure and security. The ruling is stayed for 14 days to allow for appeal, and the Justice Department has already filed one.

S&P 500, Nasdaq, Dow & Russell 2000: In the intricate world of stock trading, understanding technical levels can provide vital insights into market trends and potential future movements.

What is CCI strategy: The Commodity Channel Index (CCI) is a momentum-based oscillator developed by Donald Lambert in 1980.

Relative Strength Index (RSI) in trading: The Relative Strength Index (RSI) is a versatile and widely-used momentum oscillator in technical analysis.


