

This article examines how Iran, despite significant losses, has managed to leverage its control over the Strait of Hormuz for strategic gains. Iran's proposal to levy transit fees on ships threatens to disrupt the global economy and create a new revenue stream for the regime. The analysis explores the challenges facing the US in confronting this threat, the limitations of military solutions, the possibility of high-stakes negotiations, and the broader implications for regional countries and Asian and European markets.
After a significant sell-off, the gold market is showing signs of recovery, holding onto its annual gains and extending its multi-year, record-breaking bull run. This article examines the causes of the recent downturn, the roles of central banks and ETFs, the structural drivers supporting gold, and the future outlook in the face of geopolitical and economic challenges.
Meta Platforms is facing increasing challenges in proving its dominance in the AI arena, with recent legal developments adding a layer of uncertainty. However, some Wall Street analysts view these fluctuations as a prime buying opportunity. The stock has fallen 19% year-to-date. Morgan Stanley's analysis suggests market sentiment has hit a bottom, with expectations of a higher stock valuation. Despite regulatory concerns regarding its advertising business model, AI advancements like 'MetaClaw,' the rollout of smart shopping tools, investments in startups, and cost-cutting plans support a positive outlook.
Analysis from Goldman Sachs suggests that intense selling pressure from hedge funds and systematic investors may be creating fertile ground for a significant rebound in US equities, particularly as geopolitical tensions ease. Record short-selling positions indicate a potential turning point.

AE as Global Gold Powerhouse: As we delve into 2026, the United Arab Emirates (UAE), particularly Dubai, has solidified its status as a global gold trading powerhouse.

Trade Desk (TTD) Analysis: As financial markets experience fluctuations, especially in the tech sector, investors are often on the lookout for optimal entry points.

Cryptocurrency-related stocks analysis: The rise of cryptocurrencies has led to the emergence of various stocks tied to the crypto market.
Investing in US Stocks from South Africa: Investing in US stocks has become increasingly appealing for South African investors seeking diversification, growth opportunities, and access to some of the world's most successful companies.
How to Invest in Stocks for Beginners (Europe): Investing in stocks can be a rewarding venture for beginners in Europe.

Forex Market Today: The forex market is a dynamic environment where currency values fluctuate based on a multitude of factors such as economic indicators, geopolitical events, and market sentiment.

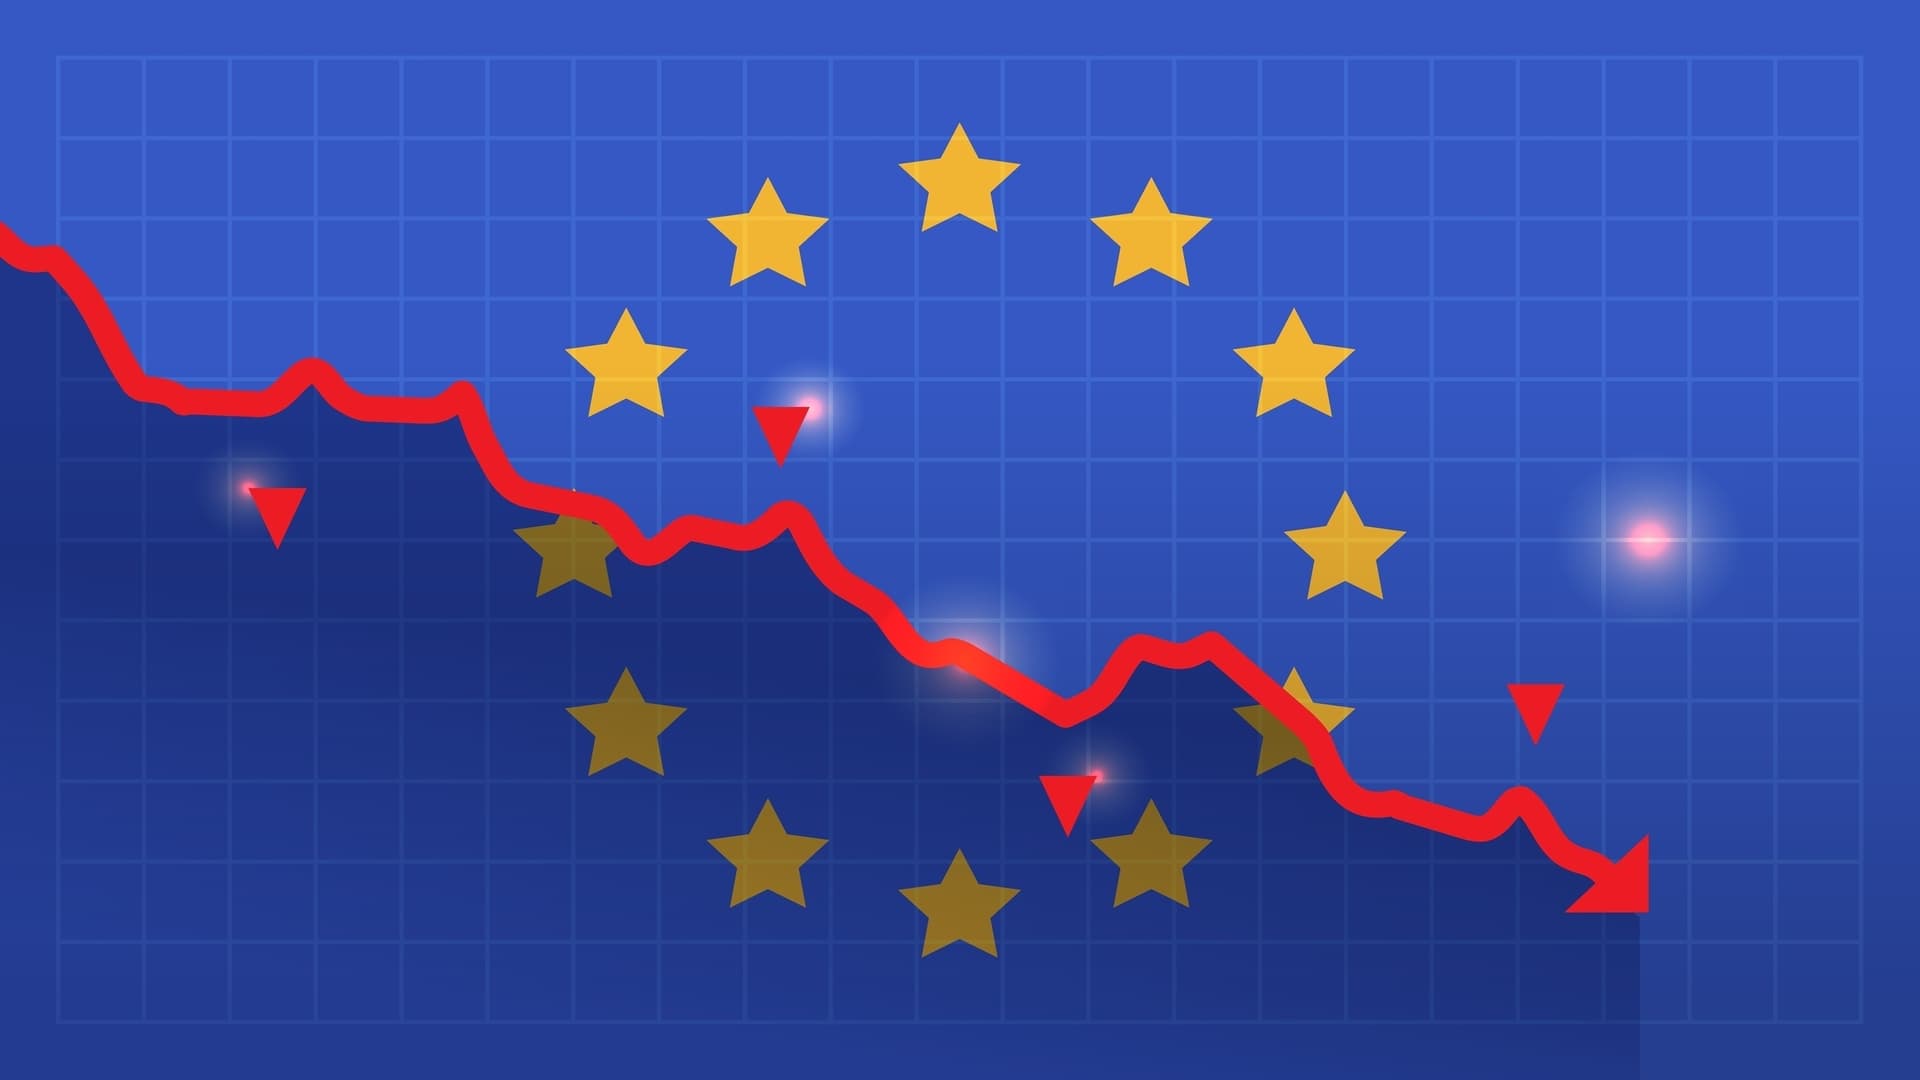
European Stocks Overview: European stock markets have recently faced significant downward pressure, primarily driven by escalating tensions in the Middle East.

Lucid Group (LCID) stock dropped 98%: The dramatic fall in Lucid Group's stock price has raised eyebrows and prompted discussions among investors.
President Volodymyr Zelensky's exploration of new partnerships in the Gulf region underscores Kyiv's growing confidence in the geopolitical landscape. This initiative aims to leverage Ukraine's innovative defense capabilities, particularly in countering aerial threats, positioning it as a solution provider for Arab nations. In return, Ukraine seeks financial, security, and political support, alongside investment in reconstruction and energy needs, with a focus on deterring Russia and Iran. These efforts emerge at a critical juncture for Ukraine, facing increasing pressure to end the conflict with Russia and diminishing Western aid.
This article examines the significant reinforcement of the US military presence in the Middle East, with hundreds of special operations forces joining thousands of Marines and paratroopers. This deployment aims to provide the US leadership with expanded options in light of ongoing developments with Iran. The piece explores the potential roles of these forces, including securing vital waterways like the Strait of Hormuz and operations against strategic Iranian targets. It also discusses the logistical and military challenges posed by the overall troop strength relative to Iran's size, raising questions about the feasibility of any large-scale ground operation.
A nuanced but significant shift is emerging in the language of Federal Reserve policymakers. While the latest dot plot still suggests rate cuts later this year, factors such as tariffs and oil prices driving up inflation, coupled with a softening but resilient labor market, have led some officials to hint that their next move could be a hike, not a cut. This development, though still a low probability event, represents a notable pivot from the clear downward trajectory for interest rates that prevailed just weeks ago. The market has begun to reflect this shift, leading to a sharp rise in long-term interest rates, which is having immediate repercussions for businesses and households.

S&P 500, Nasdaq, Dow & Russell 2000: In the intricate world of stock trading, understanding technical levels can provide vital insights into market trends and potential future movements.

What is CCI strategy: The Commodity Channel Index (CCI) is a momentum-based oscillator developed by Donald Lambert in 1980.

Relative Strength Index (RSI) in trading: The Relative Strength Index (RSI) is a versatile and widely-used momentum oscillator in technical analysis.


