


NBIS stock price prediction: As investors analyze potential opportunities in the stock market, one name that has garnered attention is Nebius Group, whose stock trades under the ticker symbol NBIS.

Tesla Stock (NASDAQ:TSLA) jumps: Tesla Inc. has experienced a notable increase in its stock price, with shares rising by 4.3% recently.

AVGO stock crashed 5.6% today: Broadcom Inc., a key player in the semiconductor industry, has faced a significant downturn in its stock price, with a drop of 5.6% reported recently.
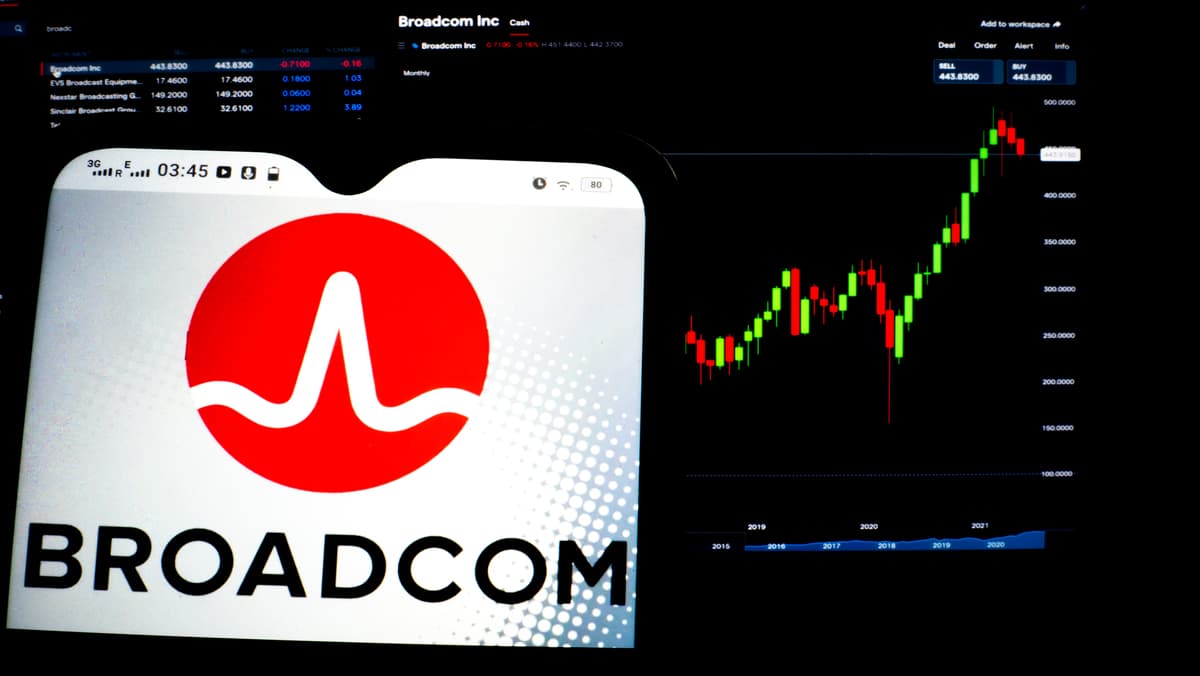
AVGO stock dropped 11% today: Broadcom Inc. has been a key player in the semiconductor industry, providing a wide range of products that serve various sectors.
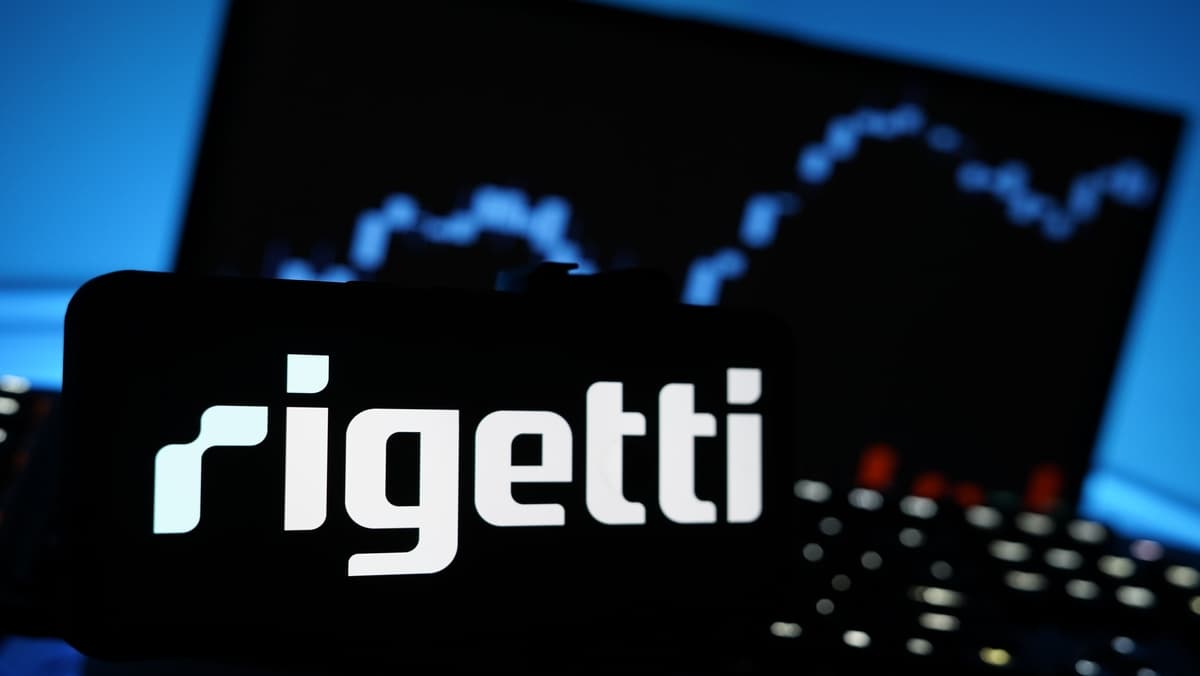
RGTI stock is dropping: the technology sector has witnessed substantial fluctuations, and Rigetti Computing, a prominent player in the quantum computing landscape, is no exception.

Gold Price Forecast: Gold has long been a cornerstone of the financial markets, often viewed as a reliable asset during periods of uncertainty and volatility.

NBIS Stock Outlook for 2026: The landscape of biotechnology and pharmaceuticals is constantly evolving, marked by rapid advancements and emerging technologies.

Gold price prediction: As we look toward 2026, many are curious about the future of gold prices, particularly concerning the XAU/USD currency pair.

What is the price of gold today: As one of the most sought-after and historically significant commodities, gold has captivated investors and traders alike for centuries.

What’s driving BTC/USD: As Bitcoin continues to capture global attention, many are speculating about its price trajectory leading up to 2026.

AVGO stock is trading down today: Understanding the factors contributing to this decline requires a closer look at the company's recent developments, market conditions, and relevant industry movements.
Top stock picks for 2026: As we look toward 2026, several stocks are capturing the attention of investors and analysts alike.
Proposed expansion of ESMA's powers raises concerns about the potential impact on the EU's crypto and fintech sectors. Centralized licensing and slower regulatory processes are key worries.
Bitcoin's 'Santa' rally may be ignited by the Federal Reserve's upcoming interest rate decision. This article analyzes the macroeconomic factors potentially influencing Bitcoin's performance into 2026.
Western Union expands into digital assets with a new stable card and plans to issue its own stablecoin, focusing on emerging markets.

Best CFD Trading Platform for 2026: CFD trading has gained significant popularity among retail investors seeking to profit from price movements in various financial instruments without owning the underlying assets.

What does CFD mean in trading: CFD is a popular financial derivative that enables traders to speculate on the price movements of various assets without actually owning the underlying asset.

A Complete Guide to Cryptos: As digital currencies gain traction across the globe, many individuals are exploring how to navigate this exciting landscape.


