


DAX 40 Index Analysis Today: The DAX 40, Germany’s blue-chip stock index, is currently undergoing a period of intense volatility.

Gold price analysis (XAU/USD): Gold remains one of the most closely watched commodities globally, often viewed as a metric of economic health, geopolitical tension, and financial market sentiment.
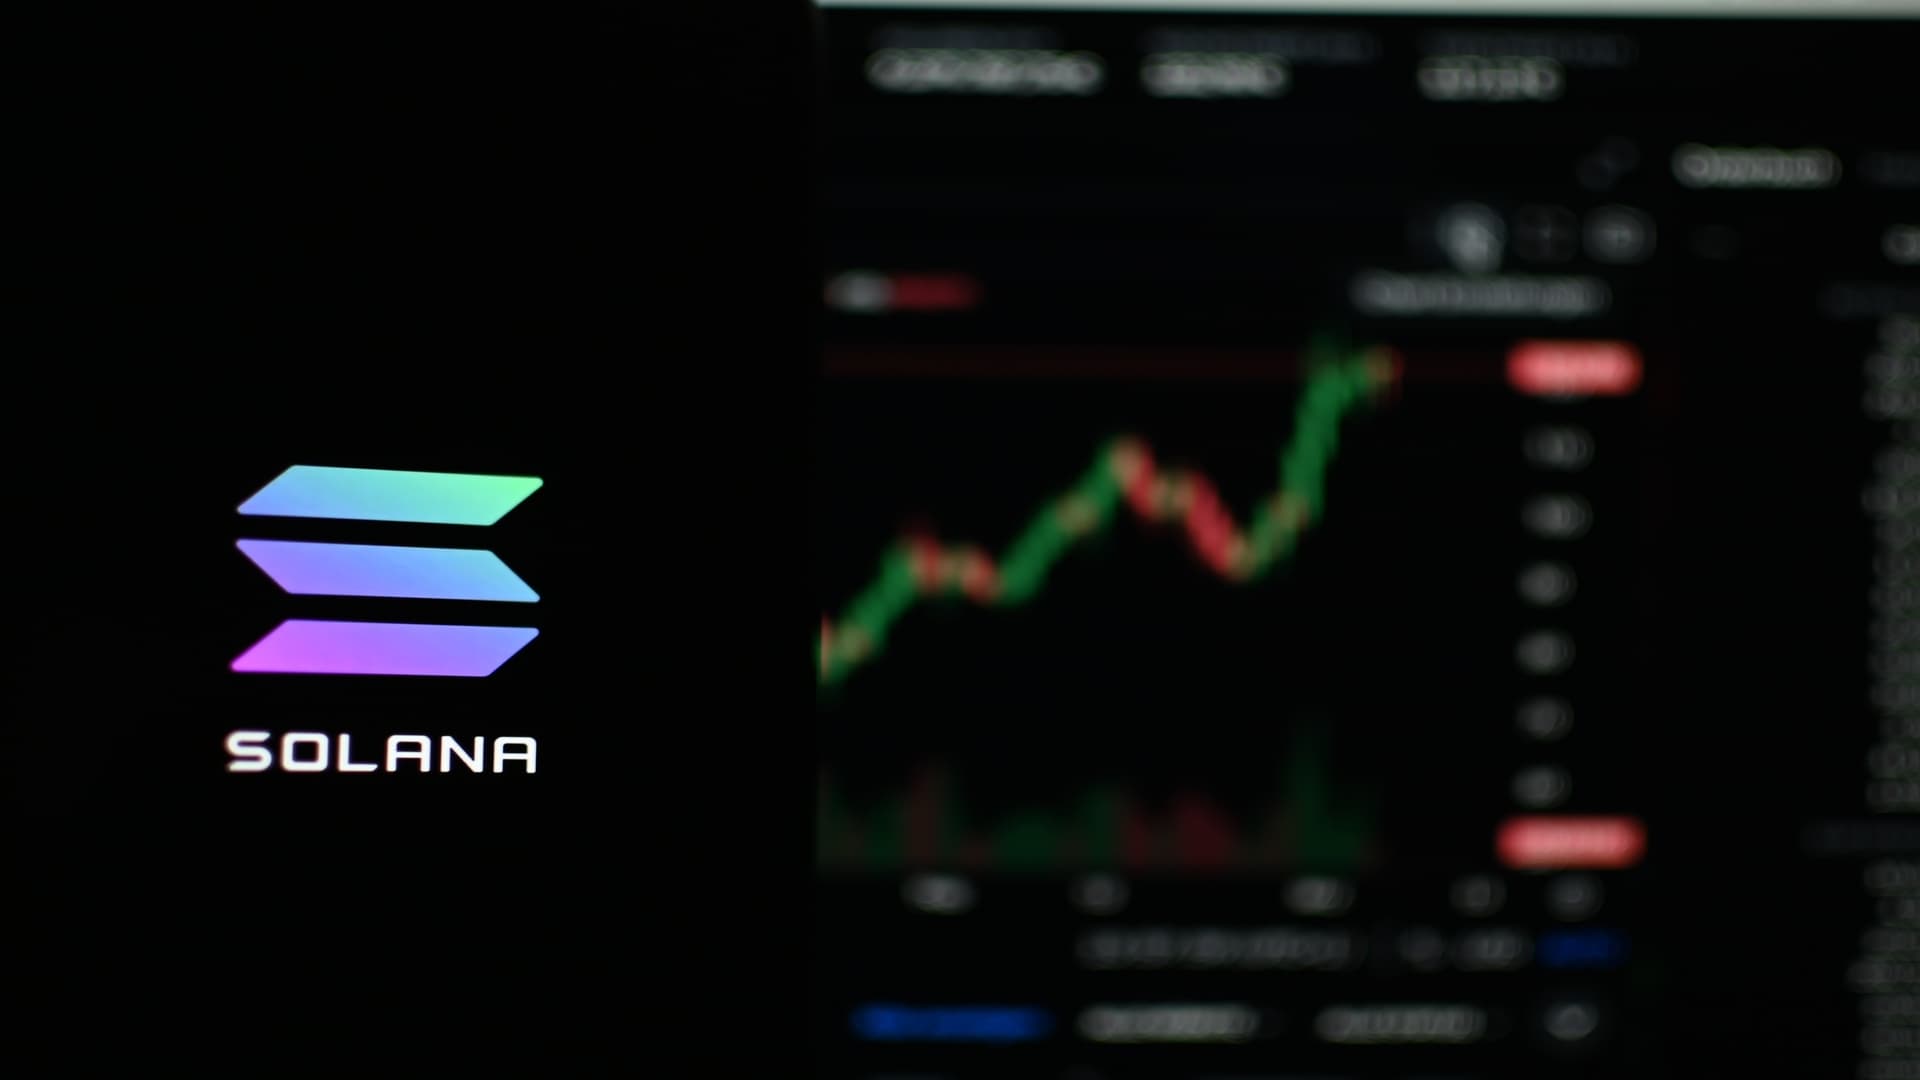
Solana price analysis: Solana, a prominent blockchain platform known for its fast transaction speeds and scalability, has recently experienced a decline in its price against the US dollar.
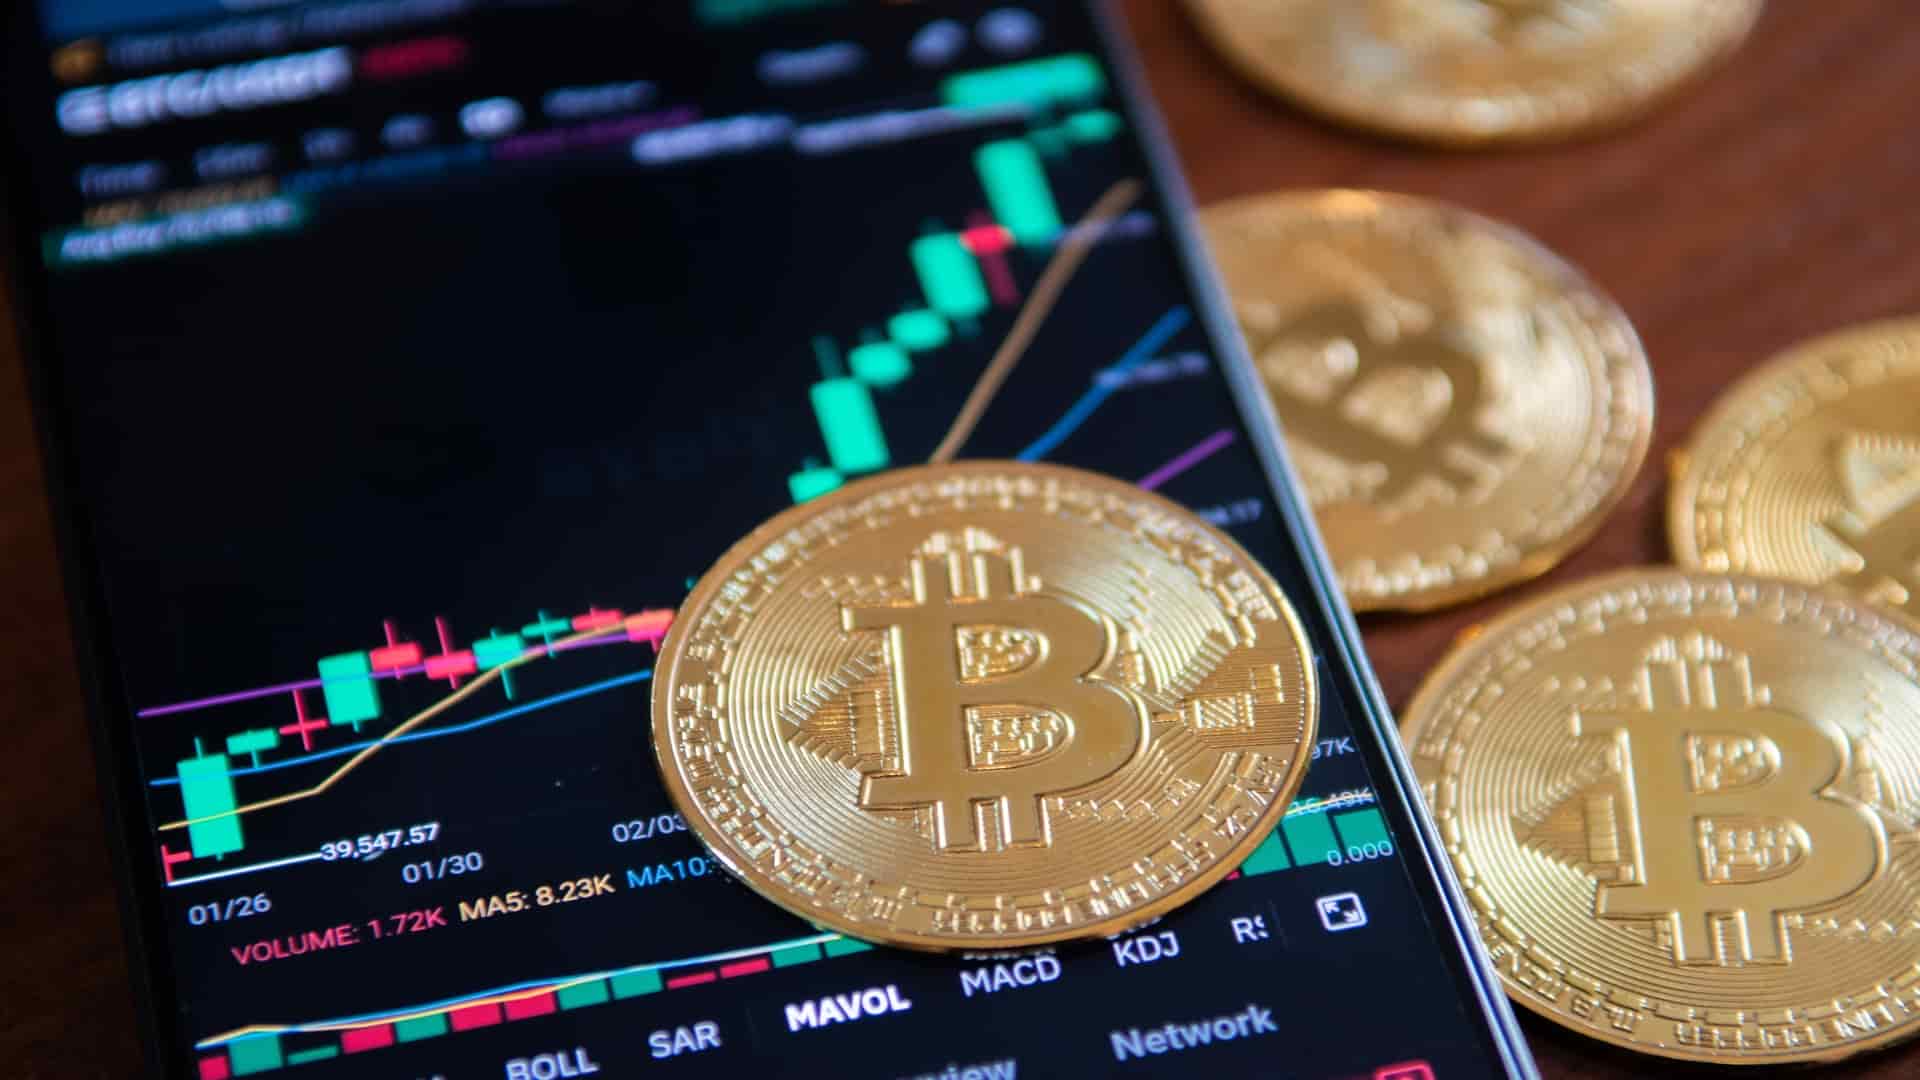
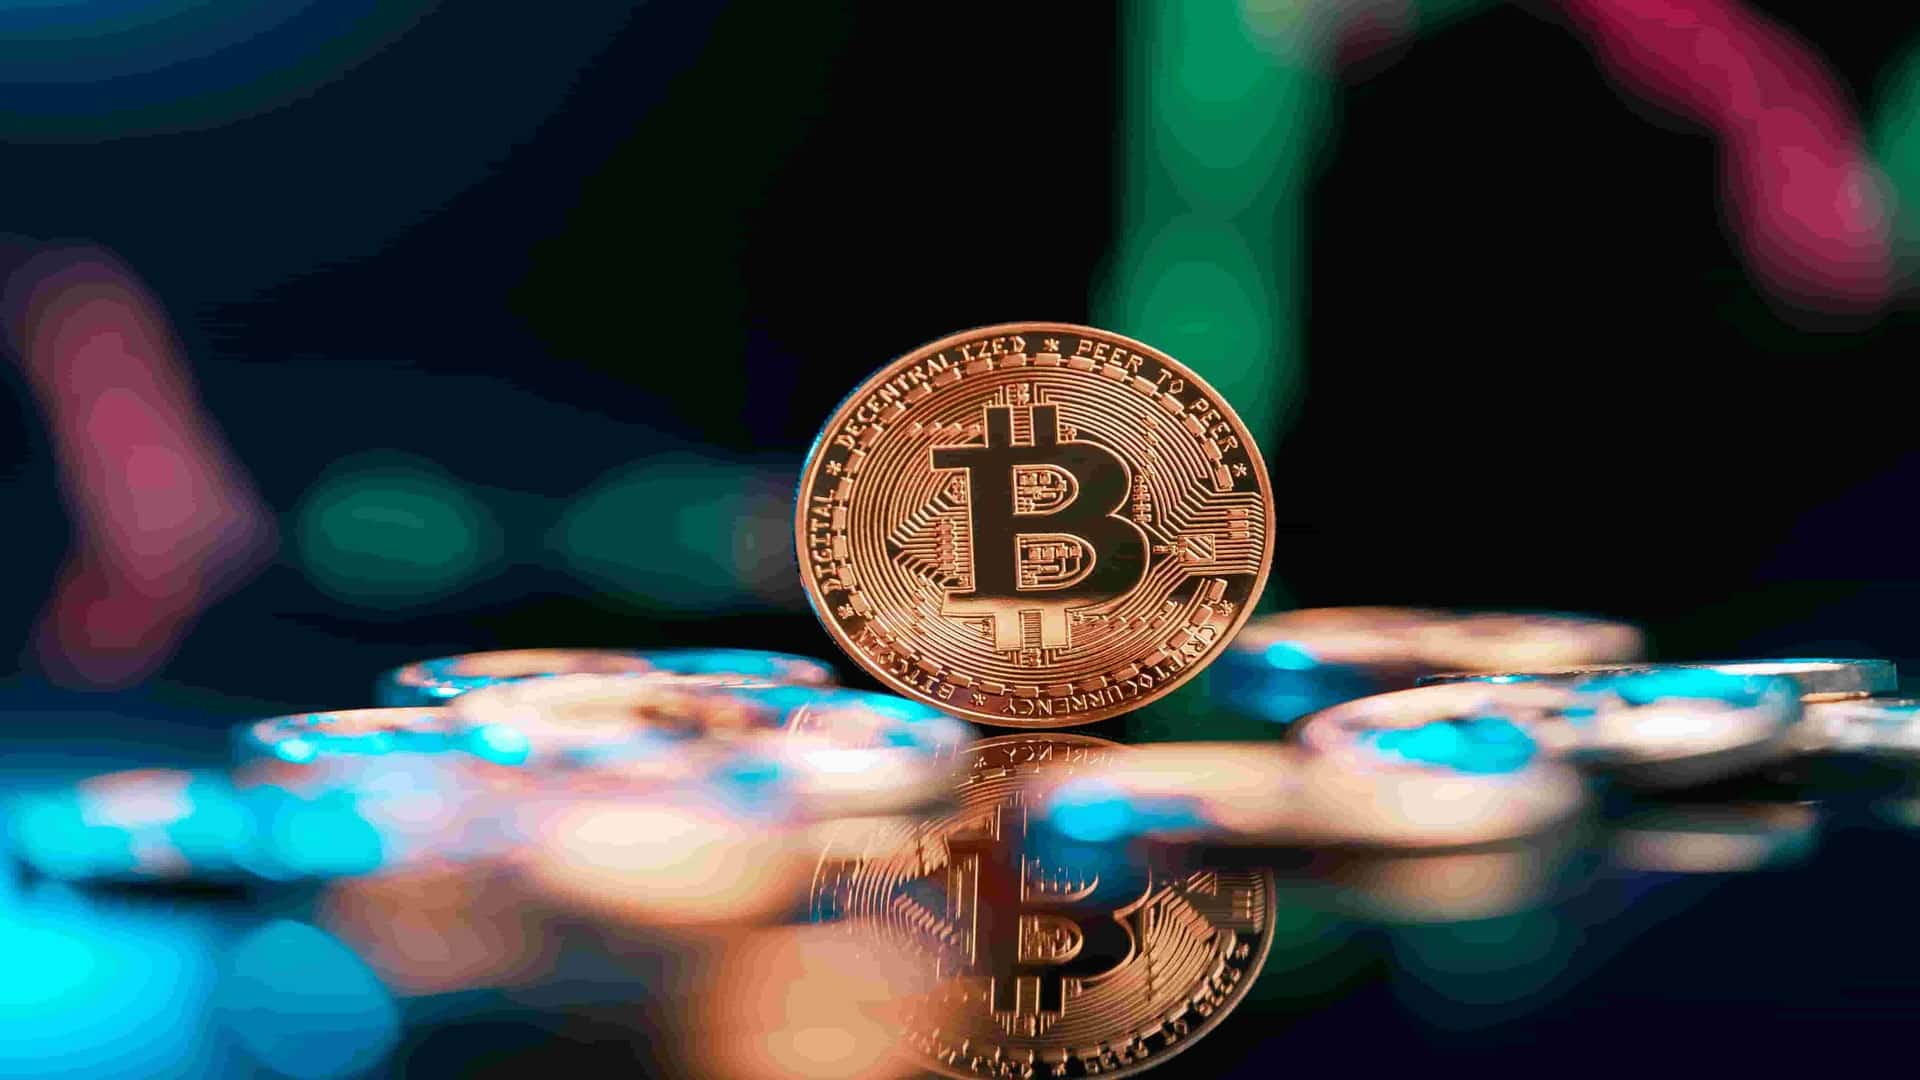
Bitcoin Analysis Today: Bitcoin, the flagship cryptocurrency and most prominent digital asset, has been demonstrating resilience recently by maintaining its value above the seventy-thousand mark.
Microsoft's SWOT analysis: As of April 2026, the global financial landscape has shifted from questioning the utility of Artificial Intelligence (AI) to frantically integrating it into the bedrock of the global economy.
FTSE 100 analysis: The FTSE 100 recently slipped beneath a critical threshold, prompting many to reassess the broader direction of the UK stock market.
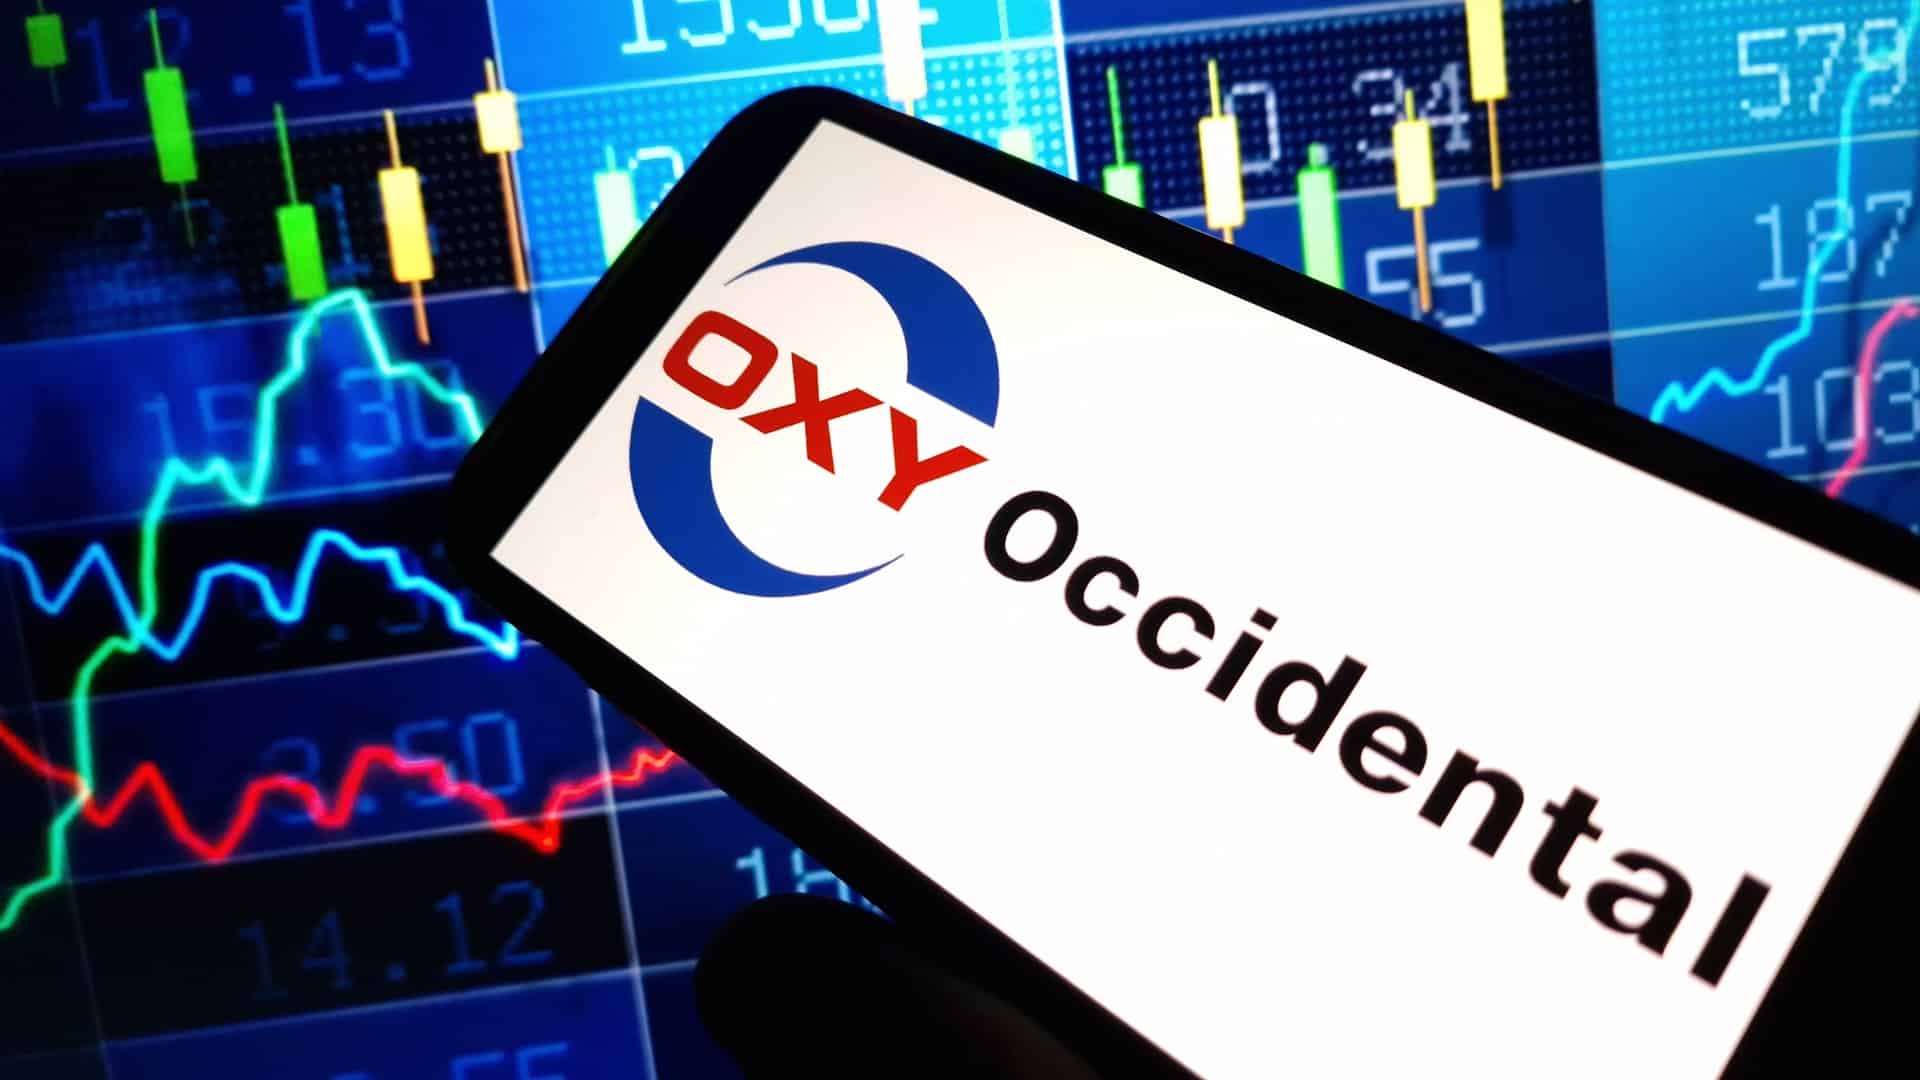
OXY stock rallied over 50% in one year: The trajectory of Occidental Petroleum Corp (OXY) over the last year has been nothing short of a masterclass in sector resilience.
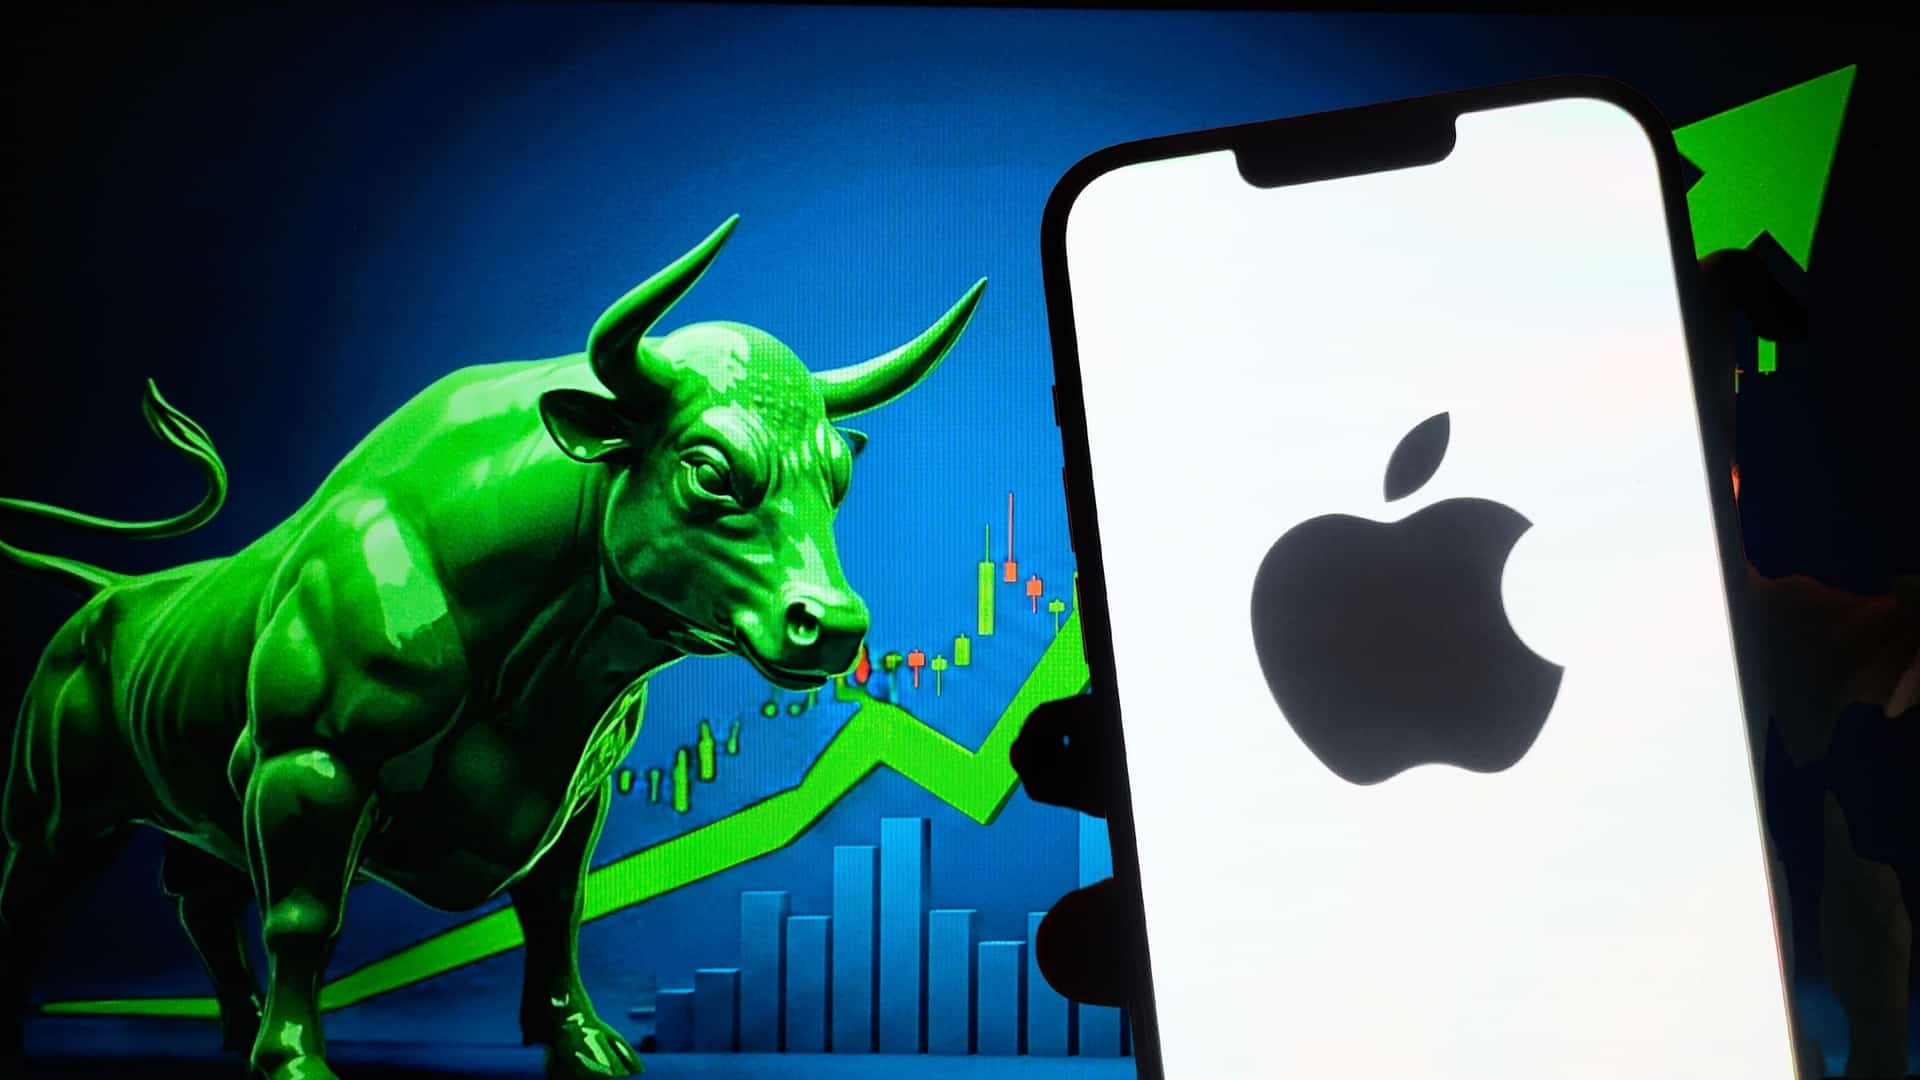
Apple (AAPL) stock overview: Apple, as one of the most influential technology companies globally, consistently draws significant attention as it approaches its quarterly earnings report.

BTC, ETH, XRP: As of April 2026, the cryptocurrency landscape has shifted from a speculative "wild west" into a sophisticated, institutional-grade financial sector.
Best crypto brokers in South Africa (2026): following the Financial Sector Conduct Authority (FSCA) decision to classify crypto assets as financial products, South Africa has become one of the most structured and secure environments for digital asset trading in the world.
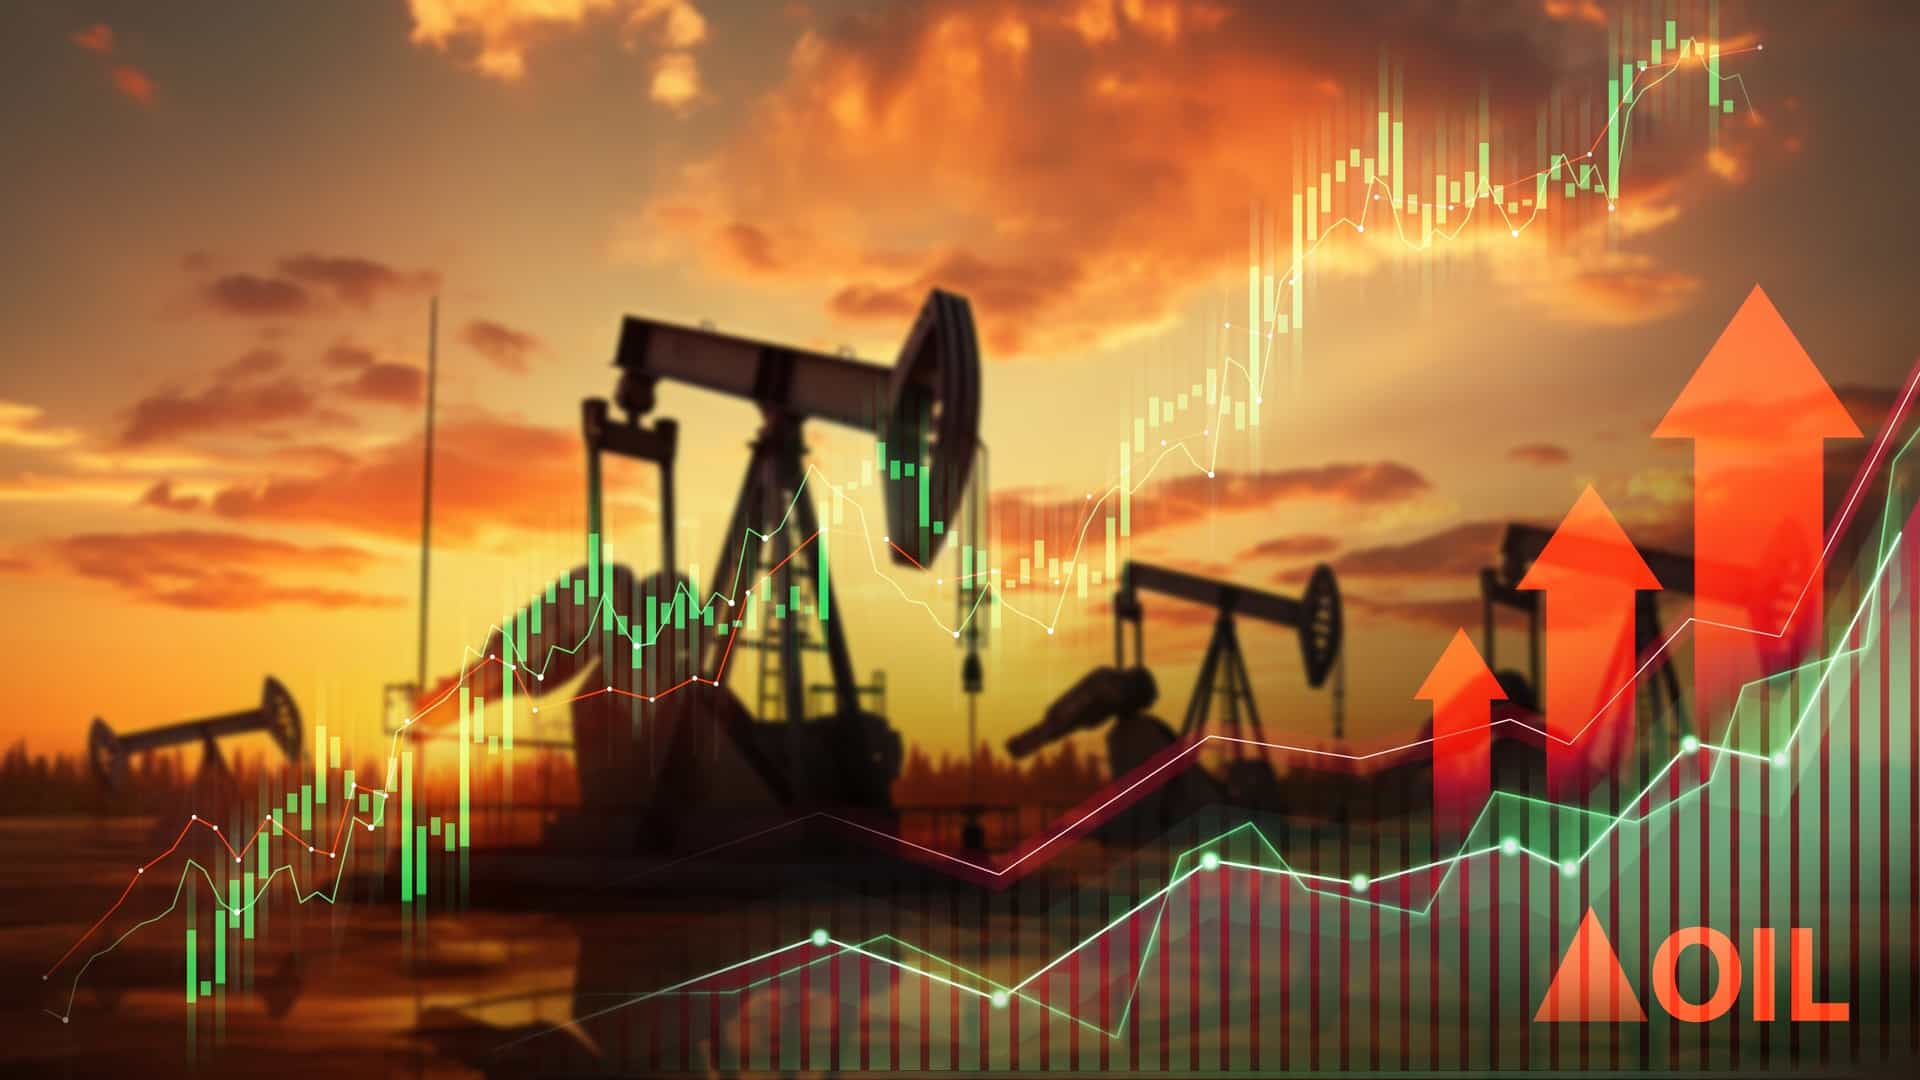
WTI crude oil price forecast: WTI (West Texas Intermediate) crude oil prices are currently hovering near the high 96 to low 97-dollar range per barrel.

Hedging strategies with CFDs: In the world of financial markets, volatility is the only constant.

Gold Price Today: The precious metals market is experiencing a volatile Tuesday as investors navigate a complex landscape of geopolitical shifts and economic data.

Commodity Market Today: Precious metals markets are experiencing heightened volatility as geopolitical uncertainty returns to the forefront.
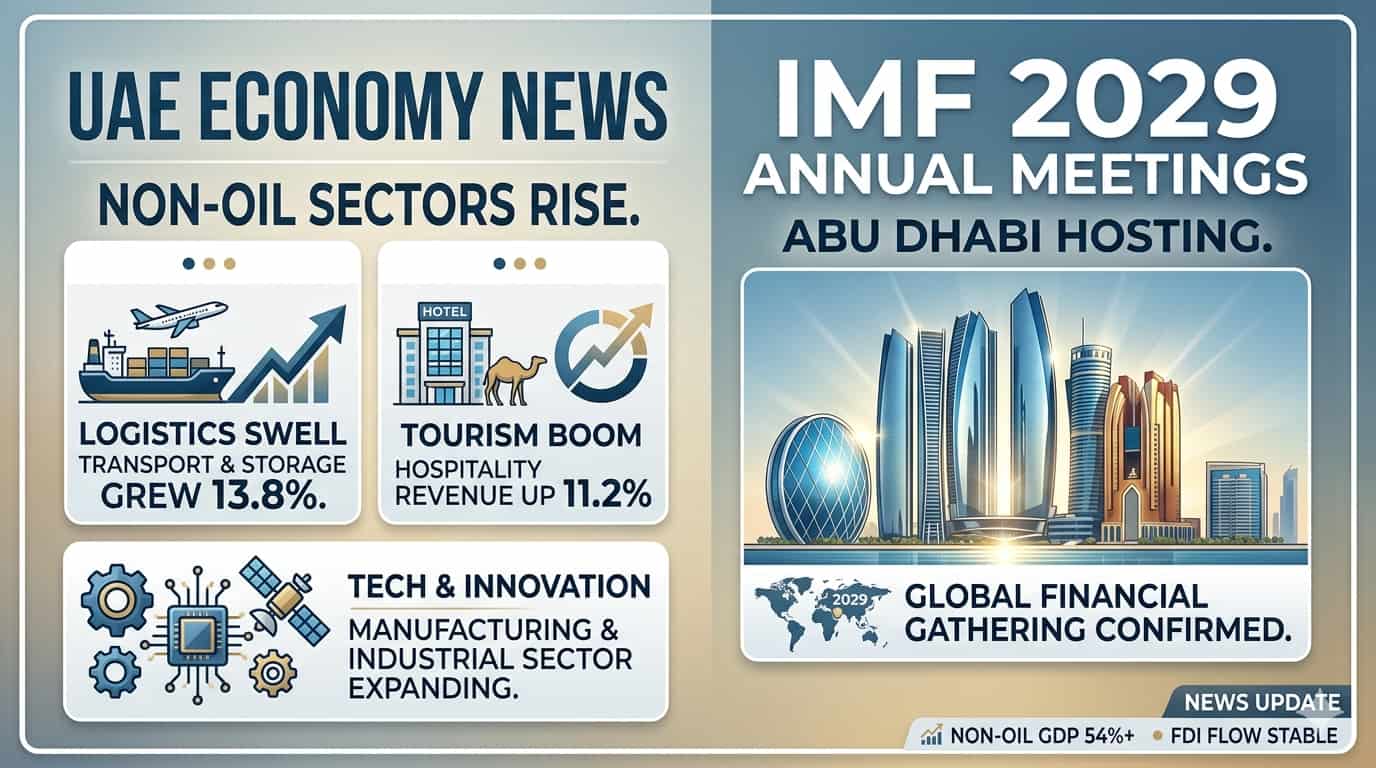
UAE Economy News: The United Arab Emirates (UAE) has entered a landmark era of economic maturity, characterized by a decisive pivot away from hydrocarbon reliance and toward a sophisticated, knowledge-based future.
Learn how to trade global Index CFDs in 2026, including leverage, margin, cash vs futures, risk management, and beginner trading strategies.
Understand Bitcoin CFDs in simple terms. Learn how they work, key benefits, risks, costs, and how to trade Bitcoin price movements without owning the asset.

Learn the difference between CFDs and futures, including expiry dates, holding costs, leverage and flexibility. Compare spot CFDs and futures-based pricing.


