


يتناول هذا التحليل التحول في لهجة الرئيس الجديد للاحتياطي الفيدرالي، كيفن وارش، من الدعوة لخفض أسعار الفائدة إلى التمسك بتقليص الميزانية العمومية، مما أثار ارتباكًا في الأسواق. يعكس هذا التغيير ضغوطًا متعددة، أبرزها التضخم المستمر، والعجز المالي الكبير، والتوترات الجيوسياسية في الشرق الأوسط، التي تقيد خيارات خفض الفائدة أو خفض الميزانية بشكل حاد. يتنبأ الخبراء بفترة ترقب للسياسة النقدية، مع التركيز على الحفاظ على أسعار الفائدة مرتفعة وتجنب التدابير الاستفزازية التي قد تزعزع استقرار السوق.
تعود أسهم شركات رقائق التخزين إلى الظهور بعد فترة من التصحيح، مدفوعة بعوامل مثل الطلب المتزايد من قطاع الذكاء الاصطناعي. يرى محللون أن دورة الرقائق لا تزال في مرحلة صعودية، وأن اتفاقيات العملاء طويلة الأجل قد تعيد تشكيل تقييم الصناعة، مع توقعات بارتفاع مستمر في الأسعار على المدى القصير إلى المتوسط، مدعومة بقيود المعروض.
مع تولي كيفن وورش منصبه كرئيس جديد للاحتياطي الفيدرالي، تتجه الأنظار نحو أول اجتماع له لتحديد السياسة النقدية. يهدف وورش إلى إحداث ثورة في أسلوب التواصل الحالي للبنك، معتبراً أن الإفراط في الإفصاح يؤدي إلى أخطاء في السياسة ويمنح البنك المركزي دوراً مبالغاً فيه. يسعى إلى إعادة تشكيل طريقة نشر التوقعات المستقبلية للسياسة وتواترها، بهدف تقليل الاعتماد على إشارات السوق المسبقة وتعزيز الاعتماد على الأساسيات الاقتصادية.
خفضت جولدمان ساكس توقعاتها لمتوسط سعر برميل النفط برنت في عام 2027 إلى 80 دولارًا. ويعزى هذا التعديل إلى زيادة قوية في نمو المعروض العالمي واستمرار ضعف الطلب. ورغم خفض التوقعات طويلة الأجل، تحتفظ الوكالة بتفاؤل نسبي للأسعار على المدى المتوسط، مع توقع وصول متوسط سعر برميل برنت إلى 90 دولارًا في الربع الرابع من عام 2026. يشير التقرير أيضًا إلى أن تأثير اضطرابات النقل في مضيق هرمز كان أقل من المتوقع، وأن فجوة العرض العالمية في الربع الثاني بلغت حوالي 5 إلى 6 ملايين برميل يوميًا، وتم تخفيفها بضعف الطلب وفائض المعروض الموجود سابقًا. من المتوقع عودة صادرات دول الخليج إلى طبيعتها بحلول نهاية أغسطس. مع ذلك، تؤكد جولدمان ساكس على أن عدم اليقين الجيوسياسي يمكن أن يؤدي إلى تقلبات سعرية حادة، مع سيناريوهات محتملة لأسعار أعلى بكثير في حالة استمرار الاضطرابات، وسيناريوهات لانخفاض الأسعار في حالة تعافي المعروض بشكل أسرع وضعف الطلب بشكل إضافي.
يشهد سوق الأسهم الأمريكية تحولاً ملحوظاً في ديناميكيات التداول، حيث تراجعت الثقة في القطاعات القيادية وتزايدت التقلبات. يوضح هذا التحليل الأسباب الكامنة وراء هذه التحولات، بما في ذلك البيانات الاقتصادية المتضاربة وتوقعات السياسة النقدية، بالإضافة إلى آراء الخبراء حول التوجهات المستقبلية. **أبرز النقاط:** * **تغير منطق التداول:** فشل المنطق السابق المعتمد على الشراء في اتجاه صاعد، مع زيادة صعوبة التنبؤ بتحركات السوق. * **تراجع ثقة قطاع التكنولوجيا:** فقدت الأسهم التكنولوجية الكبرى قوتها الرائدة، وأصبحت حركاتها السعرية متقلبة. * **زيادة تقلب المؤشرات:** بلغ تذبذب مؤشر S&P 500 مستويات قياسية، مما يشير إلى انخفاض كبير في استقرار السوق. * **عوامل التأثير:** عوامل اقتصادية متضاربة، بما في ذلك بيانات التضخم وبيانات التوظيف، تضع المستثمرين في حالة صراع بين الخوف والجشع. * **توقعات الخبراء:** يتوقع استمرار تداول القطاعات وتبادل الأنماط، مع تباعد آراء المستثمرين حول الاتجاه المستقبلي للسوق. * **التركيز على الفيدرالي:** يترقب السوق قرارات مجلس الاحتياطي الفيدرالي ومؤتمراته الصحفية كمؤشرات رئيسية للاتجاه المستقبلي. * **تحذيرات محللي وول ستريت:** تصاعد التشاؤم بين محللي وول ستريت، مع إشارات متزايدة على وصول السوق إلى قمة مرحلية.
يشير تقرير حديث من بيرنشتاين إلى أن كأس العالم 2026 قد تمثل نقطة تحول في تطوير أسواق التنبؤات، مع توقعات بأن تصل حجم الرهانات الأمريكية في أسواق مثل Kalshi و Polymarket إلى 10 مليارات دولار. وتُعتبر DraftKings المستفيد الأبرز، بفضل استراتيجيتها التسويقية القوية وحقوق البث الحصرية باللغة الإسبانية، بالإضافة إلى توسعها في مجال التنبؤات الرياضية استعدادًا لموسم NFL.
يستعرض هذا التحليل تداعيات قرار شركتي關東電化 و中央硝子 اليابانيتين بوقف إنتاج سداسي فلوريد التنجستن (WF6)، وهو غاز إلكتروني أساسي في تصنيع الرقائق المتقدمة. ويناقش الأسباب الكامنة وراء هذا القرار، بما في ذلك ارتفاع تكاليف المواد الخام، والضغوط التشغيلية، والتحديات طويلة الأمد في تأمين الإمدادات. كما يسلط الضوء على المخاطر التي تواجه شركات الرقائق الكبرى مثل سامسونج، وSK Hynix، وTSMC، والحاجة الملحة لإيجاد بدائل. ويتطرق المقال إلى الجهود المبذولة في كوريا والصين لتعزيز القدرات المحلية، وآفاق إعادة هيكلة سلسلة التوريد العالمية نحو مزيد من التنوع واللامركزية، مع الإشارة إلى أن هذه التحولات ستكون طويلة الأمد ومكلفة.
أغلق مؤشر S&P 500 عند 7,674.37 نقطة بعد مكاسب سنوية قوية، لكنه يواجه ضغط عوائد السندات وتقييمات أسهم الذكاء الاصطناعي. تحليل شامل للمؤشر وتوقعات الأسبوع المقبل ونهاية 2026.
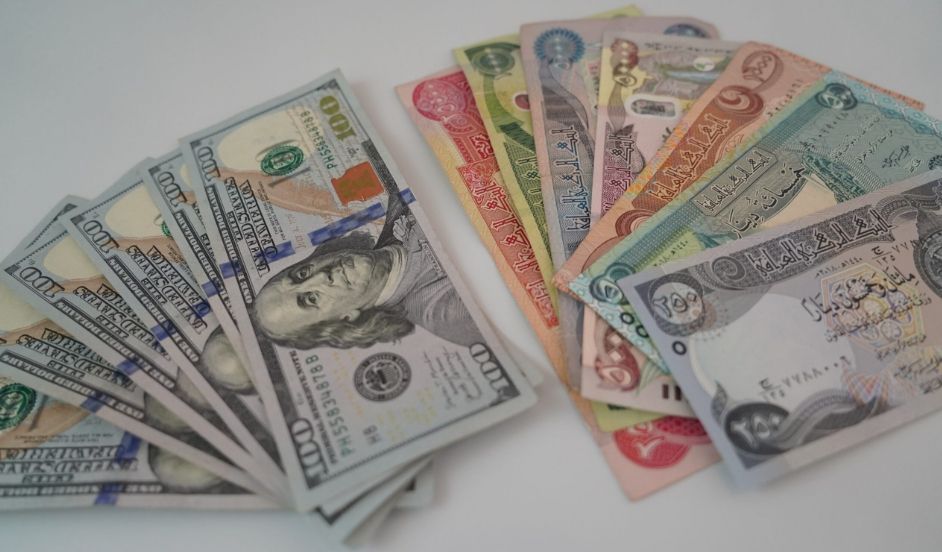
ارتفع سعر الدولار مقابل الدينار العراقي USD/IQD إلى 1,311.91 دينار في بيانات السوق، بينما تجاوز الدولار 154 ألف دينار لكل 100 دولار في السوق الموازية. تحليل أسباب ضعف الدينار وتوقعات الأسبوع المقبل.
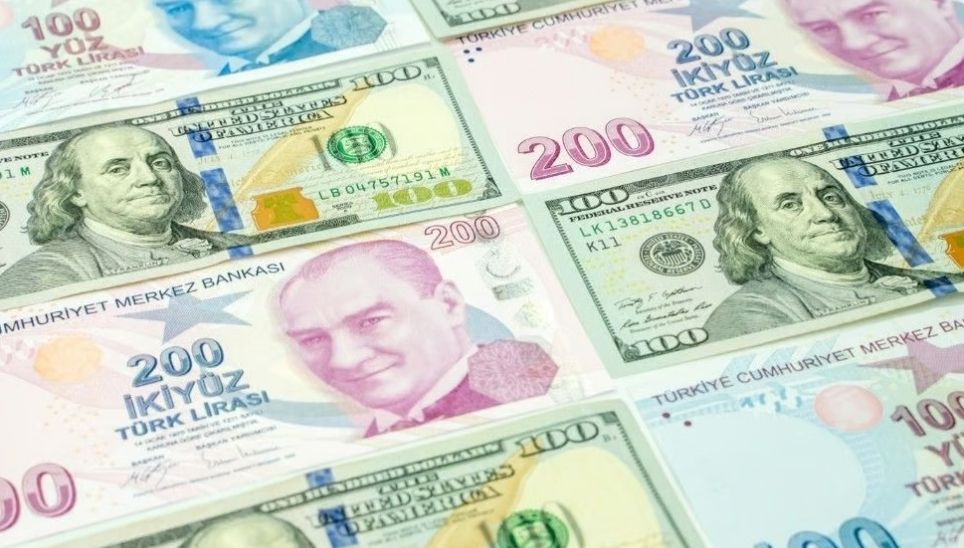
واصلت الليرة التركية تراجعها أمام الدولار الأمريكي، مع تداول زوج USD/TRY قرب 48.04 ومكاسب تقارب 9.63% خلال ستة أشهر. تعرف على أداء الزوج والعوامل المؤثرة وتوقعات الدولار مقابل الليرة للأسبوع المقبل.
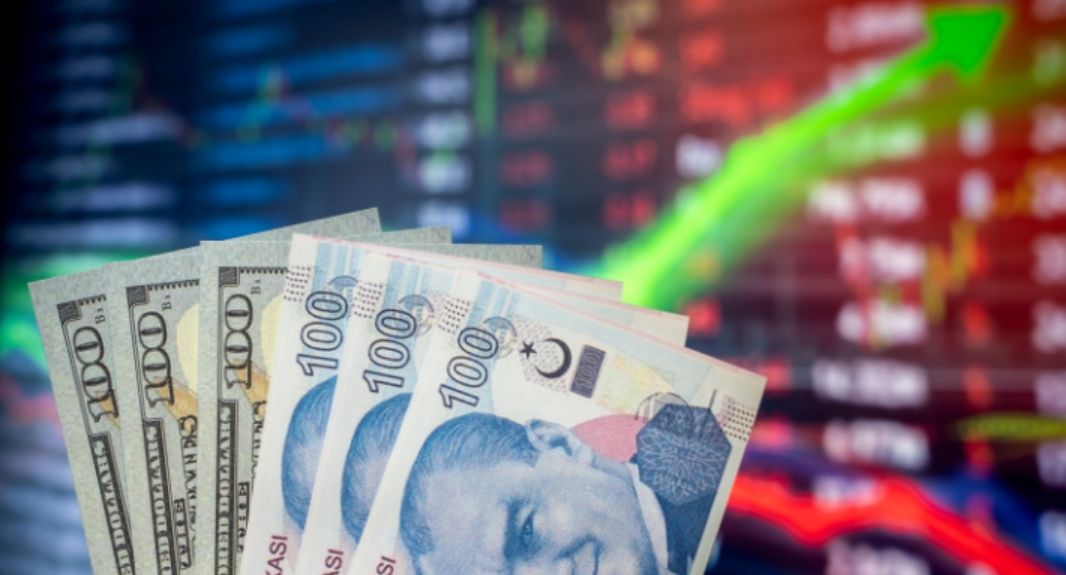
ارتفع زوج اليورو مقابل الليرة التركية EUR/TRY إلى مستوى قياسي قرب 56.25، مع استمرار ضغوط التضخم والطاقة وتباين السياسة النقدية. تعرف على أسباب تراجع الليرة وأهم المستويات الفنية وتوقعات الزوج للأسبوع المقبل.

تحليل سهم Snap المالكة لتطبيق Snapchat بعد هبوطه قرب 5 دولارات، مع نتائج الربع الثاني 2026 ونمو المستخدمين والإعلانات والاشتراكات وأهمية السوق السعودية وتوقعات SNAP. الرابط المقترح:

تراجعت أسعار خام برنت وWTI بنحو 1% مع جني الأرباح وترقب العقوبات الأمريكية على إيران. تعرف على أسباب الهبوط ومستويات الدعم والمقاومة وتوقعات النفط للأسبوع المقبل.
تعافى سهم سابك إلى 50.15 ريال، لكنه لا يزال منخفضًا 18.98% خلال عام. تعرف على نتائج الشركة وتأثير أرامكو ودورة البتروكيماويات وفرص العودة إلى قمته السابقة.
يتداول الدولار مقابل الليرة التركية USD/TRY قرب 48.08 ليرة مع انخفاض التقلبات واستمرار التراجع التدريجي للعملة. تعرف على أسباب ضعف الليرة وتوقعات الزوج خلال الأيام الثلاثة المقبلة.
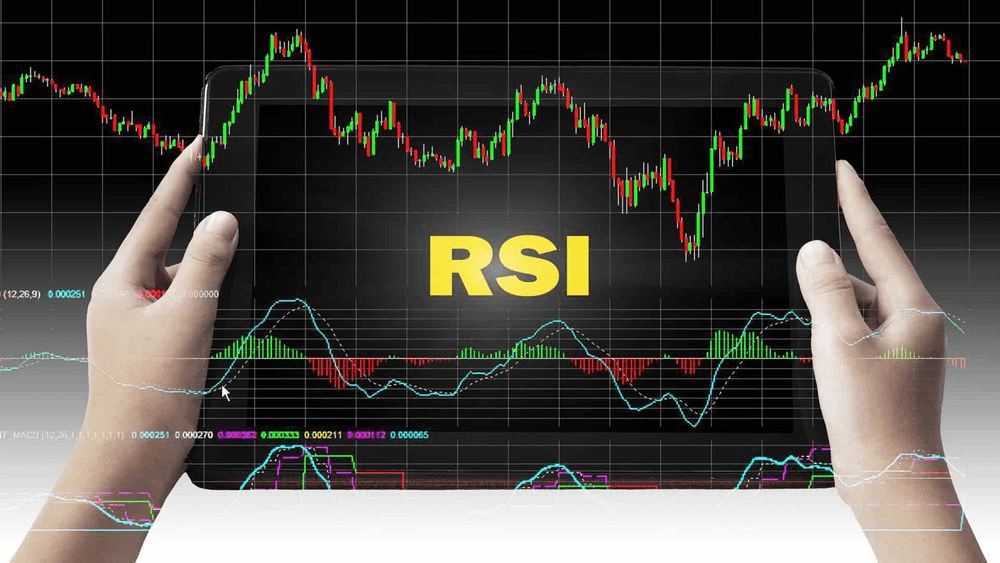
يُعد مؤشر القوة النسبية (RSI) من مؤشرات الزخم متعددة الاستخدامات والمستخدمة على نطاق واسع في التحليل الفني.
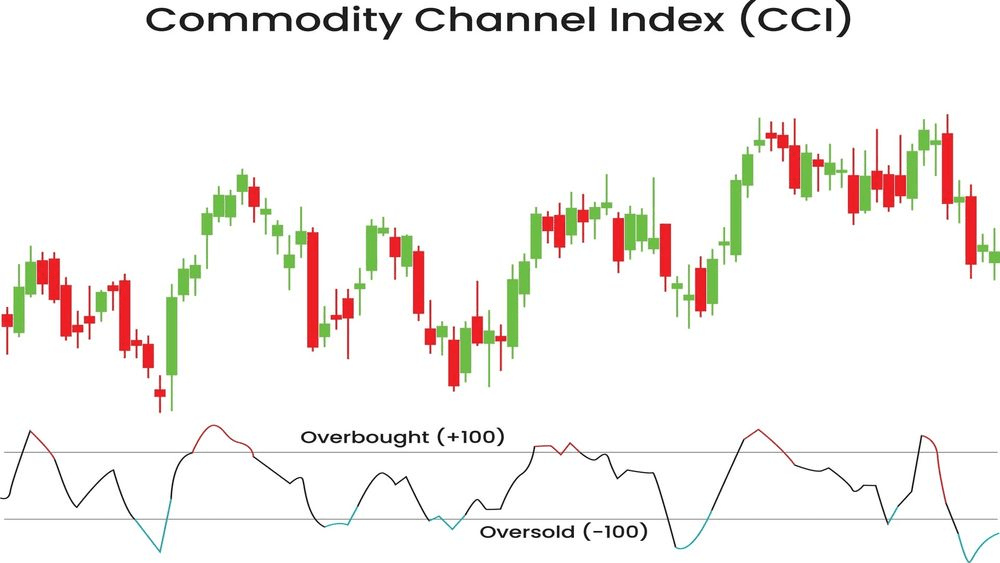
يقدم هذا الدليل شرحًا مفصلًا لاستراتيجية CCI، وطريقة حسابه، وتفسيره، واستخداماته العملية.

في هذا المقال، سوف نستكشف وظائف ومزايا واستخدامات الحساب التجريبي في تداول الفوركس، وكيفية فتح حساب تجريبي على منصة markets.com.



